What affordable housing market data and insights does Yardi Matrix offer?


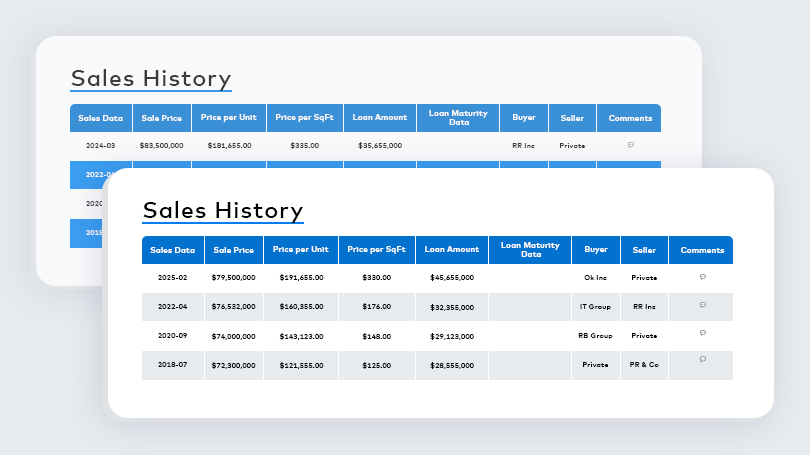
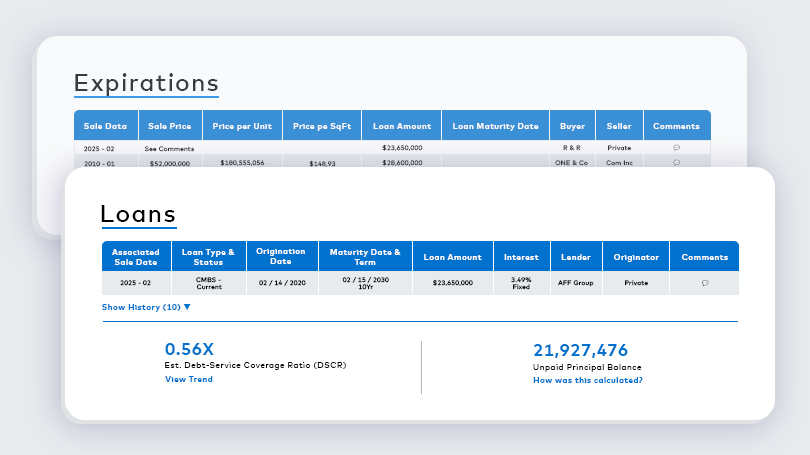
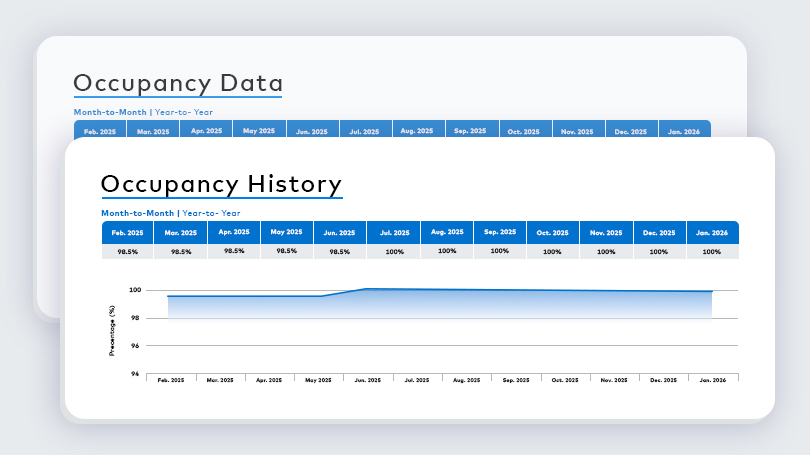
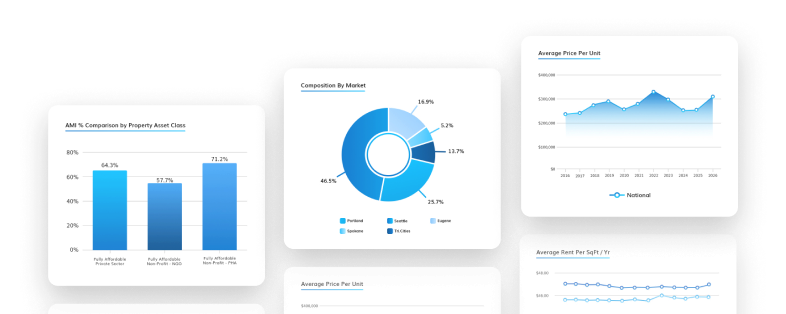
Yardi Matrix provides detailed property-level data for affordable housing communities, including unit mix, rents, occupancy, ownership information, loan data and sales history. The platform tracks affordable housing programs such as LIHTC, Project-Based Section 8 and over 900 other affordable housing programs, along with AMI restrictions, compliance periods, extended use periods and restricted unit counts. Yardi Matrix also includes demographic data, market and submarket forecasting for rents and occupancy, and a new construction pipeline that tracks development activity. Matrix Expert provides aggregated and anonymized revenue and expense comparables that allow users to benchmark operating performance.
What affordable housing reports are available in Yardi Matrix?
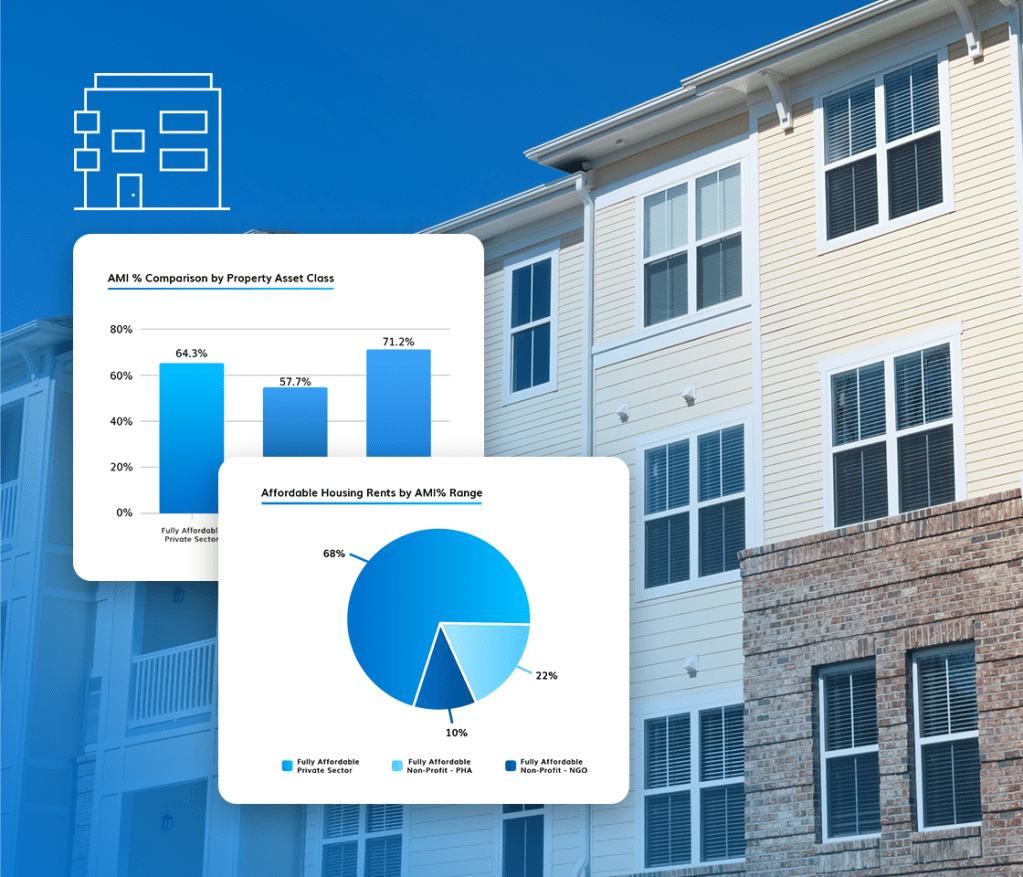
Yardi Matrix provides several reports designed specifically for affordable housing analysis. These include Affordable Housing Rents, which allows users to search by AMI splits and affordability restrictions, Market Inventory Affordability reports that compare affordability across conventional and affordable housing, and Affordable Housing – Market Rate Competitive Pressure reports that measure competition between affordable and conventional housing inventory. Additional downloadable resources include federal and state LIHTC limits, affordable housing methodology guides and affordable program definitions.
Which affordable housing markets does Yardi Matrix cover?
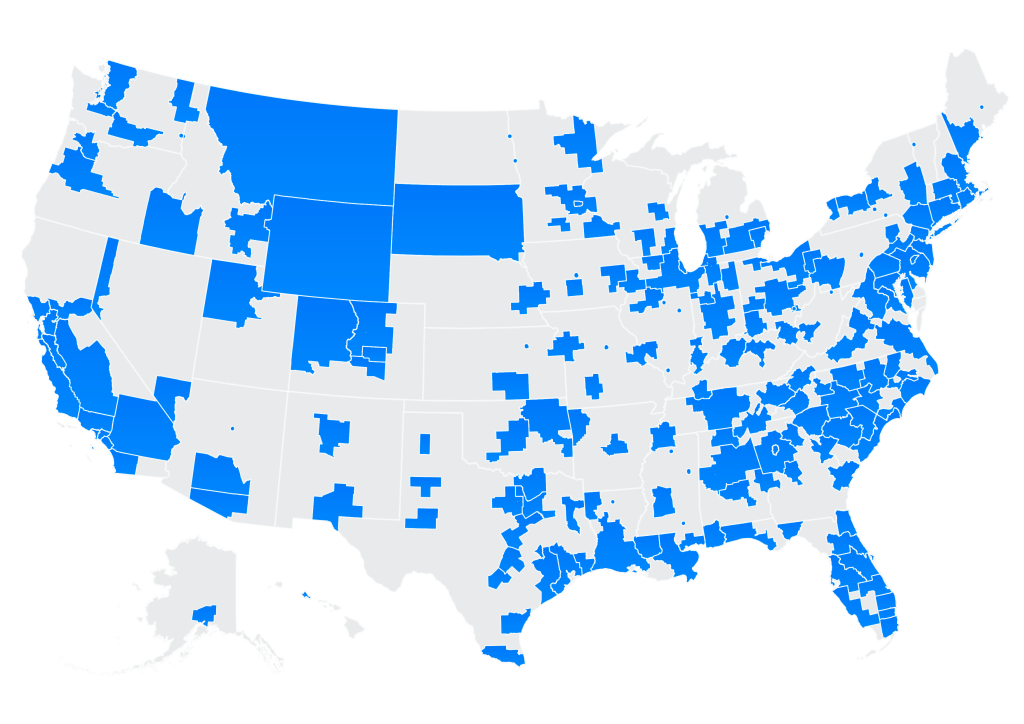
Affordable housing data is included within the Yardi Matrix multifamily platform, which covers all 181 U.S. multifamily markets. The database includes more than 42,344 properties and more than 6,516,640 units nationwide, with more than {submarket_count} submarkets available for detailed analysis. Yardi Matrix's Affordable Housing solution currently focuses on fully affordable properties, defined as properties with at least 90% of units subject to income restrictions. Detailed Coverage of partially affordable properties, defined as properties with at least 5% but less than 90% of units under income restrictions, is planned for a future release.
How can I compare two or more affordable housing properties?
Yardi Matrix allows users to compare properties using rent levels, occupancy, unit mix, sales history, ownership information and other property characteristics. Matrix Expert also allows users to benchmark revenue and operating expenses across comparable properties within the same comp set, submarket or market.
How can I find affordable housing deals in Yardi Matrix?
Apply filters for location, ownership, loan data and affordable-specific criteria, including program type and AMI levels, to build a targeted prospect list. Use sales comparables, rent benchmarks and expense data to analyze properties and evaluate investment potential.
How can I find out who owns an affordable housing property?
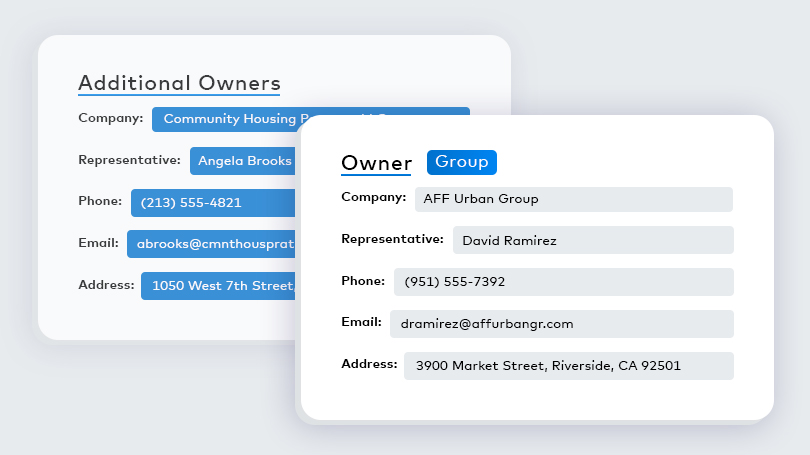
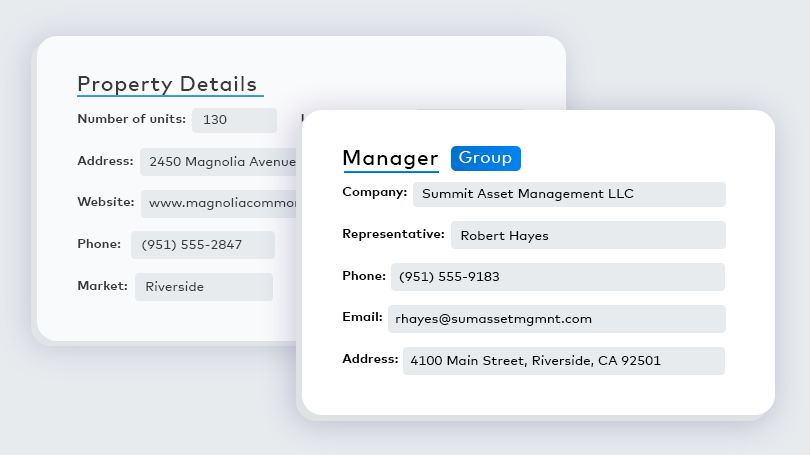
Yardi Matrix provides full ownership and management information for properties, revealing the actual property owner behind LLC structures whenever possible. The platform also includes management company information and key contacts, allowing users to identify ownership and related portfolios.
How can I find who owns the most affordable housing units?
Yardi Matrix provides ownership and portfolio information that allows users to view the properties and units associated with a specific owner or ownership group. This helps users analyze portfolios and identify major owners within a market.
How are allowable rents determined for affordable housing properties?
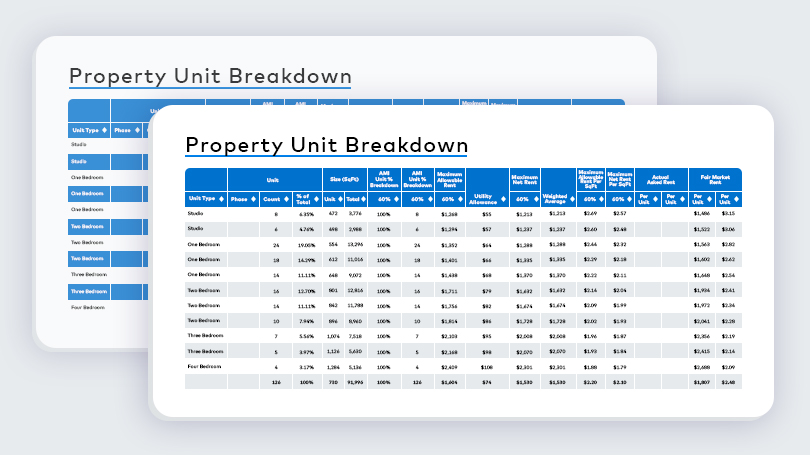
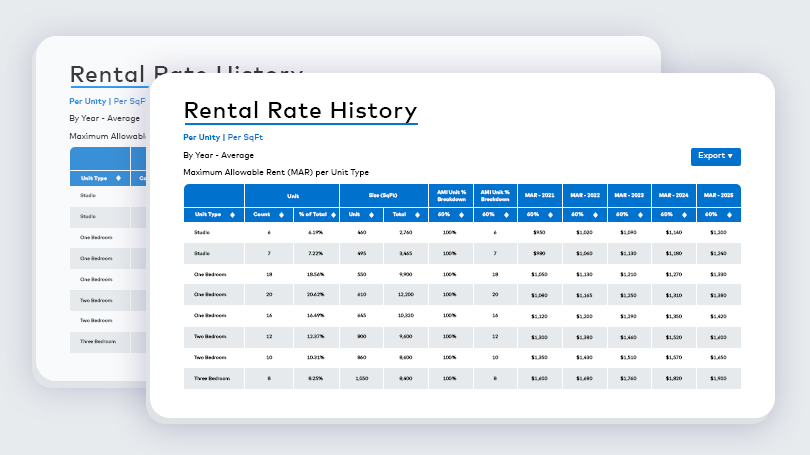
Maximum allowable rents are calculated using Land Use Restriction Agreements (LURAs) and Area Median Income (AMI) levels. These restrictions determine income eligibility and rent limits for affordable housing units. The LURA documents themselves are not displayed in the platform but are used to calculate rent limits and AMI splits.
How are actual rents represented for affordable housing properties?
Actual offered asking rents for affordable housing properties are collected from publicly available online sources and updated monthly. They reflect asking rents being charged to residents and may differ from the maximum allowable rents determined by LURA and AMI calculations. The LURA documents themselves are not displayed in the platform but are used to calculate rent limits and AMI splits. Markets are regularly reviewed based on how closely market-rate rents compete with affordable rents in each area.
How does Yardi Matrix account for properties with multiple affordability programs?
Yardi Matrix researches and displays all active programs associated with each property. It also captures program-specific restrictions, including AMI limits where applicable, allowing users to view the full set of affordability requirements across programs.
How does Yardi Matrix collect rent and occupancy data for affordable housing properties?
Yardi Matrix uses publicly available online sources. Markets are regularly reviewed and updated depending on how closely market-rate rents compete with the affordable sector in each area. Occupancy estimates are derived from USPS delivery records, which track active mail deliveries across approximately 140 million addresses per month and are matched to property unit counts.
How frequently is affordable housing data updated in Yardi Matrix?
Rental rates and occupancy data are updated monthly. Sales, management, construction and loan information is updated daily as new information becomes available. Forecasts for rents and occupancy are updated three times per year.
How does Yardi Matrix track new affordable housing development activity?
Yardi Matrix tracks the development pipeline, including projects that are planned, prospective and under construction. This allows users to monitor future supply and development activity across markets.
What demographic and location data is available for affordable housing analysis?
Yardi Matrix provides demographic data within one-, three- and five-mile radiuses of a property, including population forecasts, population density and income levels. Map layers also include median household income, median age, share of the population that rents and traffic counts.
How can affordable housing data be exported for further analysis?
Users can export property data, reports and maps directly into Microsoft Excel. Yardi Matrix also offers custom export options for qualified organizations with advanced data management and reporting needs. This allows investors, lenders and analysts to integrate Yardi Matrix intelligence into internal financial models, presentations and reporting workflows.
How does Yardi Matrix classify affordable housing properties?
Yardi Matrix classifies affordable housing properties based on the percentage of units subject to income restrictions. Fully affordable properties have at least 90% of units under income restrictions, while partially affordable properties have at least 5% but less than 90% of units under income restrictions. Fully affordable properties are further categorized by ownership sector and affordability program.
What affordable housing programs does Yardi Matrix track?
Yardi Matrix tracks multiple affordable housing programs, including Low-Income Housing Tax Credit (LIHTC), Project-Based Section 8 and over 900 other affordable housing programs. Properties may have both primary and secondary affordability types, allowing users to see layered affordability structures and subsidy programs associated with a property.
What affordable housing compliance and restriction data is available in Yardi Matrix?
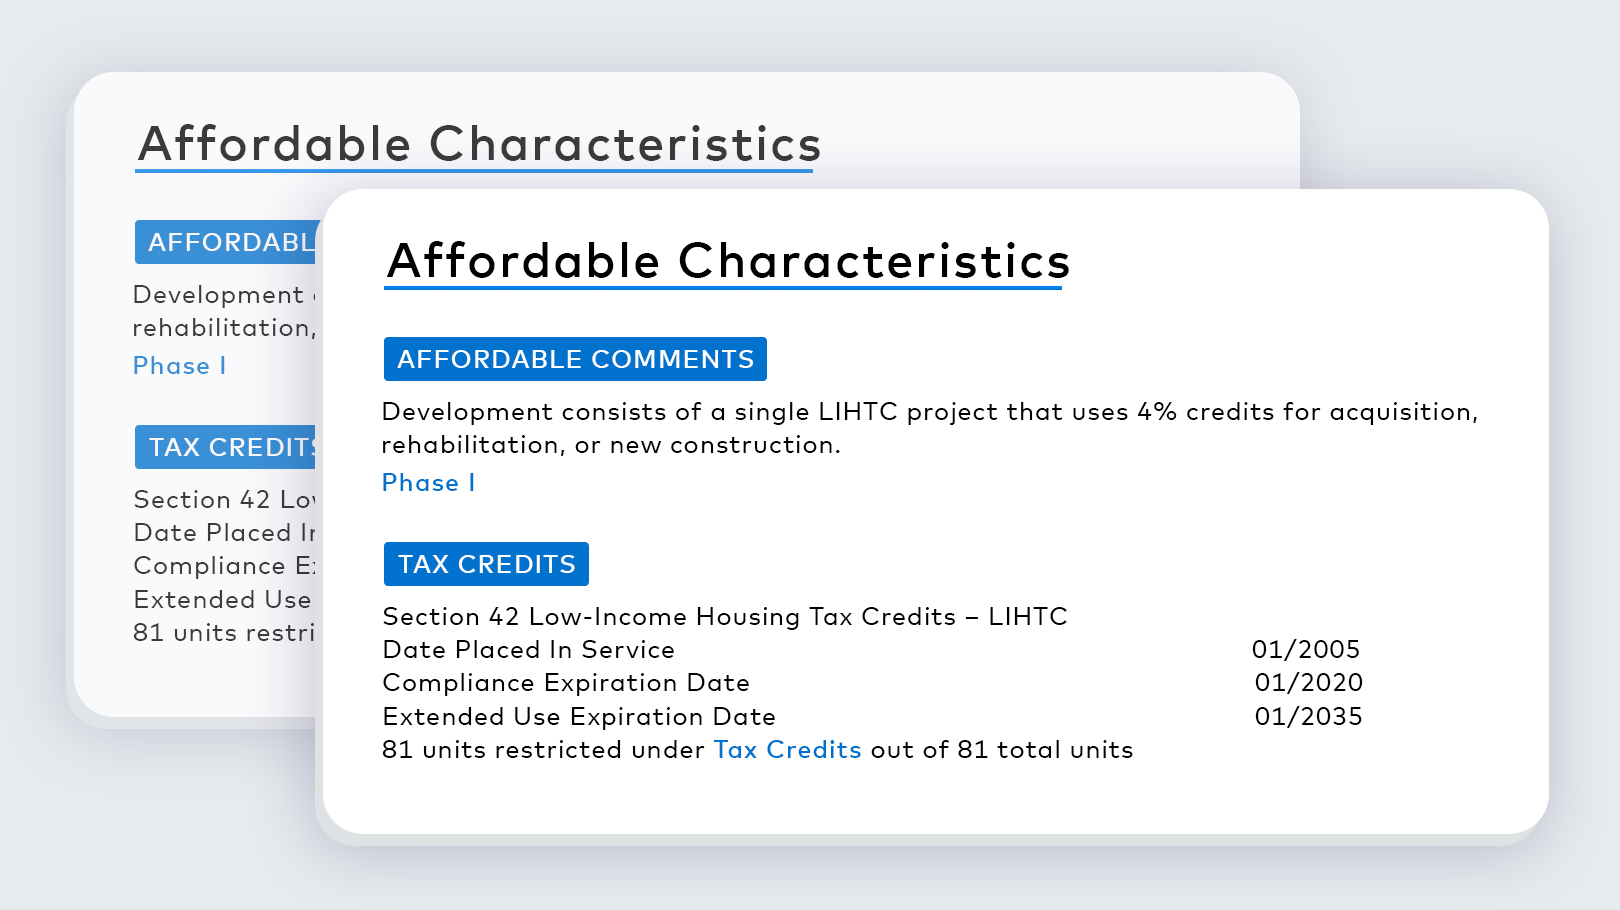
Yardi Matrix provides detailed affordability restriction information, including compliance expiration dates, extended use expiration dates, dates placed in service, tax credit allocation dates and the number of restricted units. Users can also review affordable housing comments that provide additional context on affordability restrictions, program requirements and special designations.
How does Yardi Matrix calculate affordable housing rents?
Yardi Matrix calculates Maximum Allowable Rent (MAR) and Maximum Net Rent (MNR) using HUD income limits, family size adjustments and Area Median Income (AMI) restrictions. The platform also tracks actual asked rents, utility allowances, Project-Based Section 8 contract rents and Fair Market Rents, allowing users to compare affordable rents against market conditions.
How can I search and segment affordable housing properties in Yardi Matrix?
Yardi Matrix allows users to search and segment affordable housing properties using affordability characteristics such as ownership sector, affordability program, AMI restrictions, compliance periods and affordability type. Users can also filter properties located in Qualified Census Tracts (QCTs), Difficult Development Areas (DDAs) and other affordable housing-related categories.
How do I start using Yardi Matrix?
An active subscription is required. Once a subscription is established, users receive login credentials and access to training and support resources. To learn more about subscription options or to get started, contact our sales team.