


ULI Fall Meeting
Register now
Multifamily market data and insights
The data platform investors, lenders and brokers rely on to originate, underwrite and transact multifamily assets. In-place loan details, ownership transparency, rent comps and pipeline intelligence are all built into one platform covering 92% of the U.S. population.
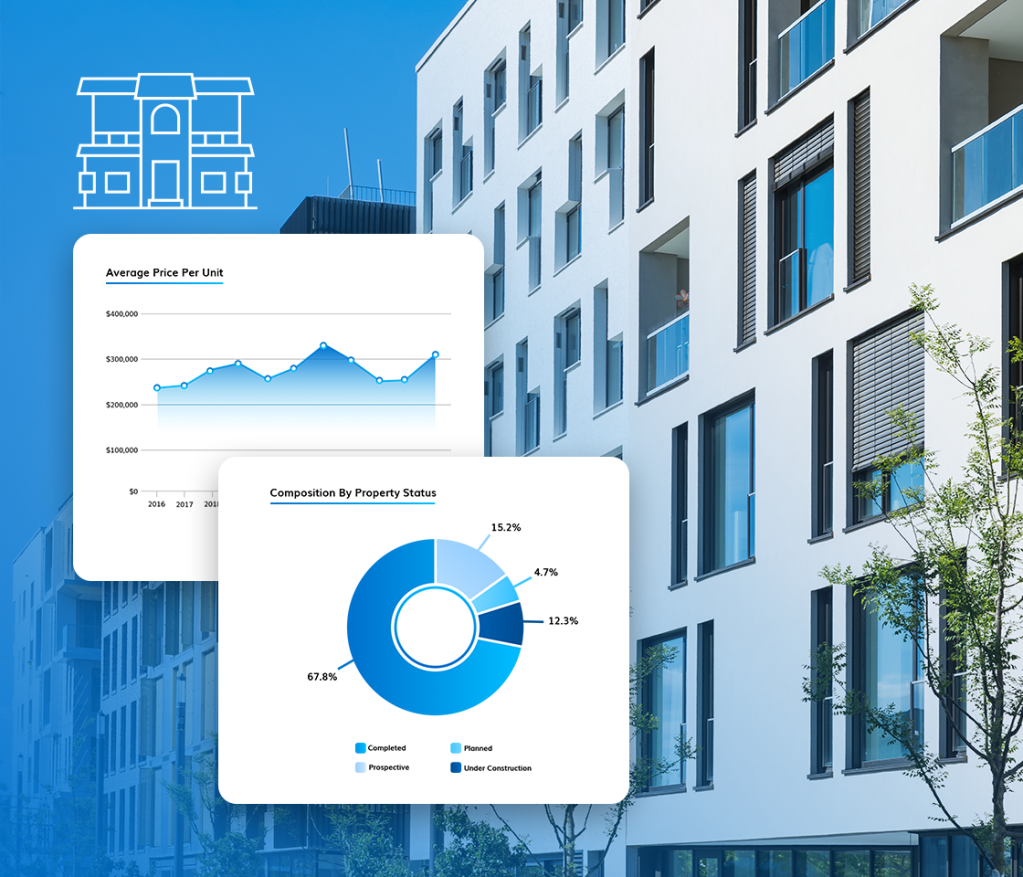
Explore our multifamily property data
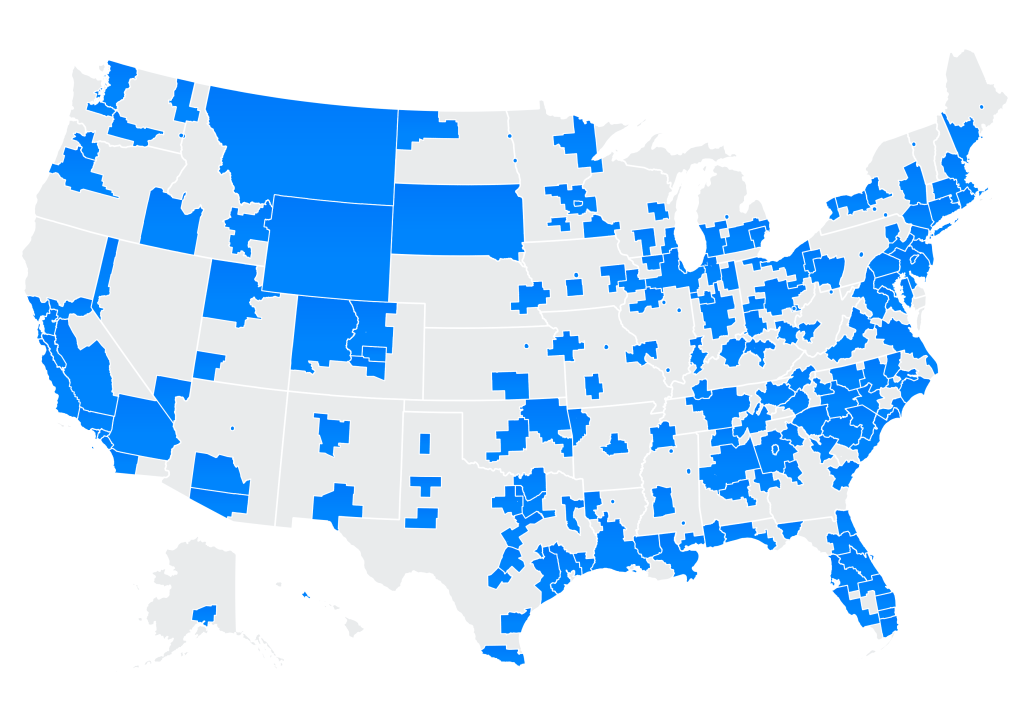
We are active in 190 multifamily markets across the U.S., providing researched data on properties with 50 or more units.
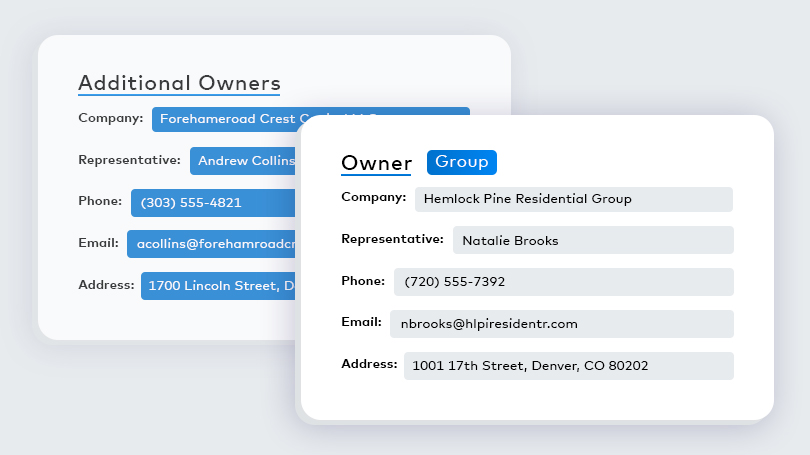
Full ownership data
Matrix surfaces the real owners behind LLC structures, with key contacts and full portfolio visibility down to the individual property level.
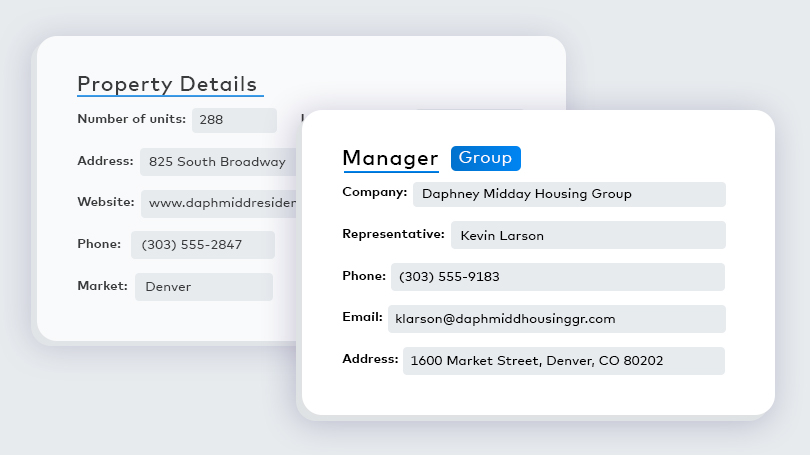
Full management data
Reach management companies and key decision-makers directly, so you can source acquisitions, originate loans or pursue third-party management assignments.
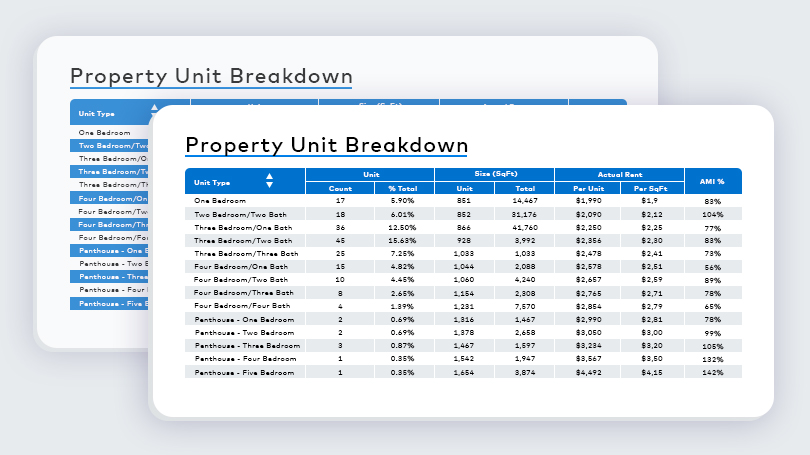
Unit breakdown
Access detailed unit mixes for standard and non-standard floor plans that includes bedroom counts, square footage and rent by unit type helping you build accurate revenue models.
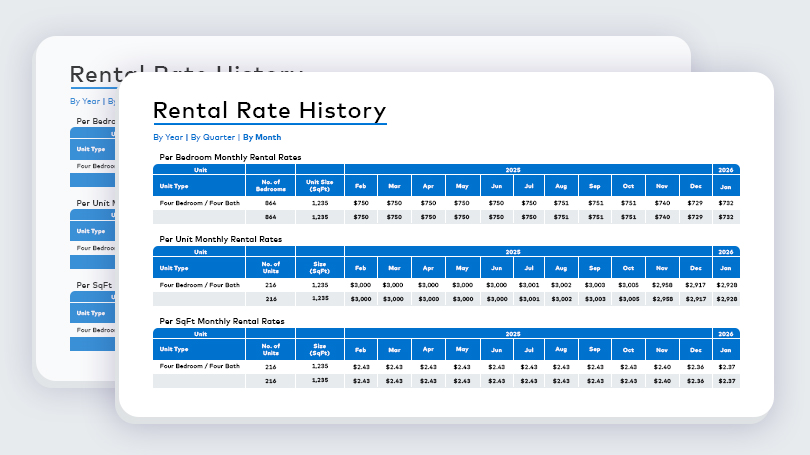
Rental rate history
Leverage Matrix rental rate history to determine income potential, competitors' performance, understand a market/submarket environment and more.
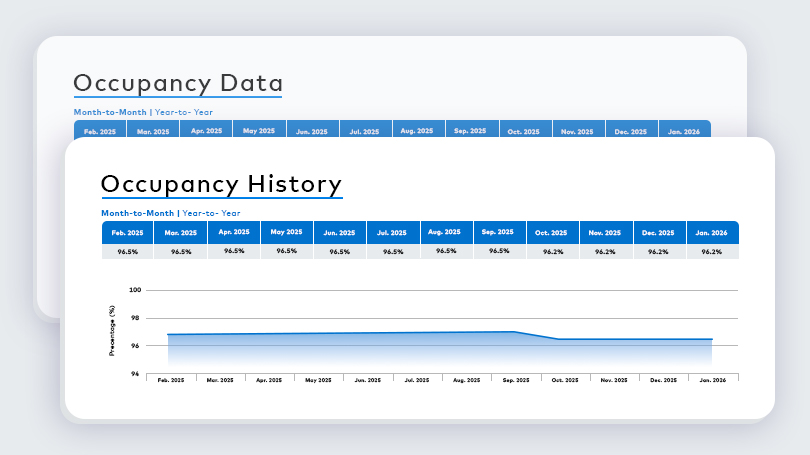
Occupancy history
Analyze trends, compare property performance, assess risk and formulate pricing strategies with extensive occupancy history data.
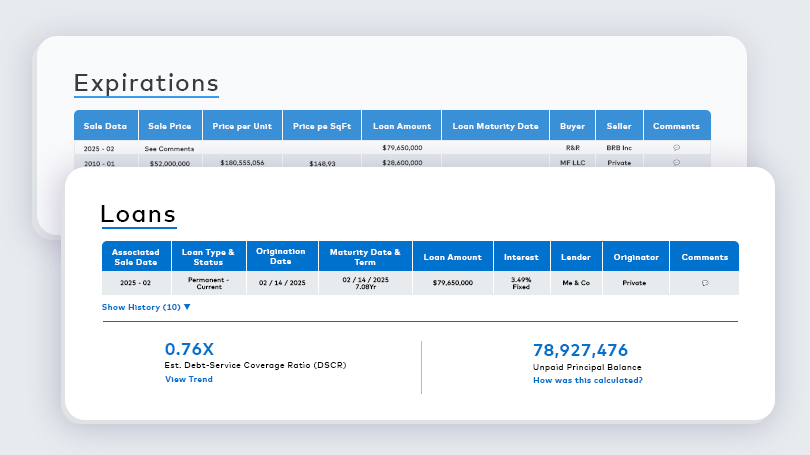
In-place loans and expirations
Monitor loan maturities, identify refinancing windows and sharpen underwriting with comprehensive debt data including balance, originator, maturity date and loan type across construction, permanent and CMBS structures.
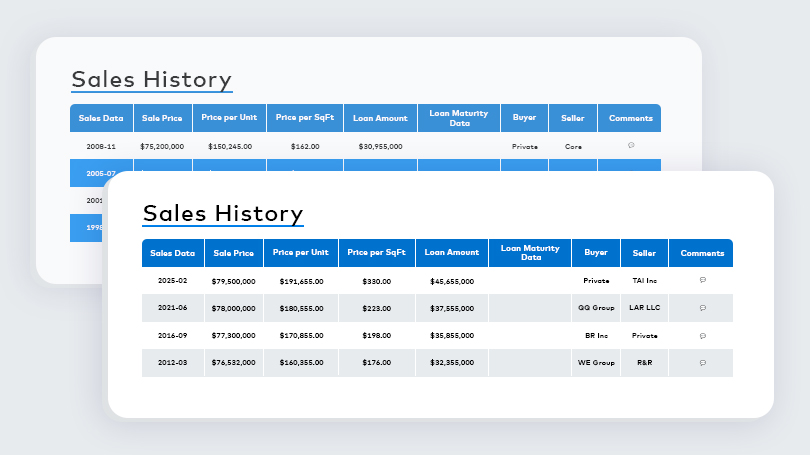
Sales history
Inventory, transaction, pipeline and performance, all in one platform.
See the full market picture
Inventory, transactions, pipeline and performance, all in one platform.
Book a demo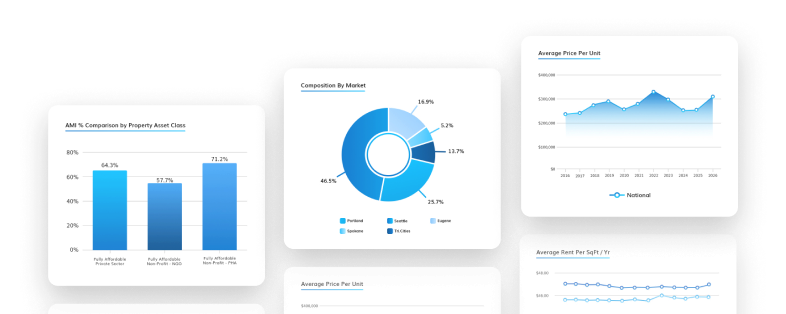
Key benefits

National coverage
Comprehensive coverage of every multifamily asset with 50 or more units across 190 U.S. markets: LLC ownership, senior contacts, in-place debt details and continuously updated sales, rent and occupancy trends, all in one place.

Actionable analysis
Everything needed to build financial models, complete acquisitions and originate loans with confidence are easily searched: Property-level rent comps, in-place debt, sales comparables and expense benchmarks.

Market insights
Stay ahead of the competition with institutional research covering market trends, rent and occupancy forecasts, supply pipeline outlooks and investment strategy.

Accurate tracking
Benchmark any asset against your own portfolio, competitors or acquisition targets. Monitor portfolio health with complete rent, occupancy, sales and loan data, all updated regularly.
Get more insights with Matrix Expert
Subscription-only Expert reports deliver deep financial intelligence using aggregated and anonymized actual operating income and expense data. Filter by geographic area, submarket, asset class and other property characteristics to get benchmarks no broker report can match.
Market Financials Summary
Offers in-depth market financial information including income, expenses, capital expenditures and more.
Market Operational Summary
Delivers market data on rent, occupancy, lease trade outs and other operational metrics.
National multifamily market coverage
With active coverage in more than 190 U.S. multifamily markets, Yardi Matrix provides the depth and breadth of data investors, lenders, brokers and researchers rely on, from detailed unit mix and rent comps to in-place loans and end-to-end supply pipeline tracking. View our full market coverage to understand where you can source multifamily opportunities with confidence.
Comprehensive real estate market reports
The newest numbers are in. Fresh national and metro-level reports updated monthly.
View publications
Request a demo today!
See how Yardi Matrix can work for you
Benefit from the industry's most comprehensive market intelligence platform for real estate professionals underwriting and managing multifamily, affordable housing, student housing, SFR/BTR, office, industrial and self storage assets.
Fill out your contact info and we'll be in touch soon.
FAQ
How is Yardi Matrix different from other multifamily data providers?


Yardi Matrix delivers property-level intelligence that goes beyond listings and surface-level analytics. We provide full ownership transparency, in-place loan data with balances and maturities, detailed unit mix and rent data updated monthly, as well as a comprehensive new construction pipeline that includes early-stage developments. Matrix Expert provides aggregated and anonymized revenue and expense benchmarking, enabling true comparisons at the comp set, submarket and market levels.
How many multifamily markets does Yardi Matrix cover?
Yardi Matrix covers all 190 U.S. multifamily markets, encompassing 89,533 properties and 18,026,592 units nationwide. The platform provides granular visibility across 3,500+ submarkets, allowing you to analyze performance at both market and submarket levels. This depth of coverage supports acquisitions, underwriting, asset management and portfolio strategy across nearly the entire institutional multifamily landscape.
What types of loan information are available for multifamily properties?
Yardi Matrix provides in-place debt information for multifamily properties, including loan balance, originator, loan type and maturity date when available. This data allows users to identify refinancing opportunities, monitor upcoming loan maturities and better understand capital structures across properties and portfolios.
How does Yardi Matrix estimate DSCR and LTV for multifamily properties?
Estimated debt service coverage ratio and loan-to-value metrics are calculated by combining loan data with rent, occupancy and expense benchmarks from Matrix Expert. These estimates allow users to identify potential distress, evaluate financing risk and compare leverage levels across similar properties. DSCR and LTV estimates are available at the individual property level and can be used to screen large portfolios for refinancing risk or acquisition opportunity at scale.
How does Yardi Matrix support revenue and expense benchmarking for multifamily properties?
With Matrix Expert, users can benchmark actual revenue and operating expenses using aggregated and statistically anonymized data. You can evaluate performance at the comparable set, submarket or market level to refine budgets, validate underwriting assumptions, assess operating efficiency and strengthen valuation models. New and renewal lease trade outs, in-place rents, turnover %, collections% and other operational metrics are often otherwise impossible to obtain. This enables more precise analysis than relying solely on pro forma assumptions or broker-reported figures.
What forecasting tools are available in Yardi Matrix for rent, occupancy and supply?
Yardi Matrix provides rolling one- to 10-year forecasts for rent growth, occupancy and supply at the market and submarket levels. Forecasts are updated three times per year and are supported by detailed tracking of new supply, including projects under construction, in planning or prospective phases. This forward-looking intelligence helps investors and lenders anticipate market shifts and model performance under various scenarios.
How does Yardi Matrix support preliminary underwriting and value-add opportunity identification?
Yardi Matrix supports preliminary underwriting by providing detailed unit mix, asking rents, occupancy, sales comparables, expense benchmarking and in-place loan information. Users can validate cap rates, estimate revenue, analyze rent gaps relative to competitive properties and calculate estimated DSCR and LTV metrics. Custom polygon searches and filters — such as property age, relative rent positioning and loan maturity schedules — allow you to identify value-add acquisition targets, refinance opportunities and assets with operational upside.
How does Yardi Matrix handle ownership transparency and decision-maker contacts?
Yardi Matrix reveals full ownership information behind LLC structures, providing direct visibility into the actual property owner and related portfolio holdings. The platform also includes management company information and key decision-maker contacts, enabling users to efficiently source acquisitions, originate loans, pursue third-party management assignments or develop business relationships. This level of ownership transparency significantly reduces research time and improves direct access to the right stakeholders.
How does Yardi Matrix collect multifamily rent and occupancy data?
Yardi Matrix gathers rent data through a nationwide research team that contacts properties each month as prospect renters and verifies current asking rents and concessions; we also receive direct feeds from property management companies as well as rentcafe.com of publicly available information. Occupancy estimates are derived from USPS delivery records, which track active mail deliveries across approximately 140 million addresses per month supplemented by calls directly to the properties. This combination of direct property research and large-scale data validation allows Yardi Matrix to maintain highly accurate rent and occupancy data across markets.
How does Yardi Matrix track new multifamily development activity?
Yardi Matrix tracks the full multifamily development pipeline, including projects in planning, prospective and under construction phases. This early visibility into new supply allows users to evaluate future competitive inventory, anticipate potential rent pressure and identify development opportunities before projects are delivered.
How does Yardi Matrix support property comparisons within a competitive set?
Yardi Matrix enables users to compare properties based on rent levels, occupancy, unit mix, sales history, improvement ratings and other characteristics. These comparisons help investors, lenders and operators understand how a property performs relative to similar assets within the same submarket.
How frequently is multifamily data updated in Yardi Matrix?
Rental rates and occupancy data are updated monthly, ensuring users have current visibility into market performance. Sales, loan, management and construction information is updated continuously as new information becomes available. Forecasts for rent, occupancy and supply are updated three times per year to reflect the latest market conditions and development activity.
How can multifamily data be exported for further analysis?
Users can export property data, reports and maps directly into Microsoft Excel, Word or PDF. Yardi Matrix also offers custom export options for qualified organizations with advanced data management and reporting needs. This allows investors, lenders and analysts to integrate Yardi Matrix intelligence into internal financial models, presentations and reporting workflows.
How do I start using Yardi Matrix?
To use Yardi Matrix, your organization must have an active subscription. Once a subscription is established, users receive login credentials and access to training and support resources. To learn more about subscription options or to get started, please contact our sales team.