

Average Sales Prices Decline in the CBDs
Ending what has been a challenging year, office investment actually topped 2020, as the sector looks for silver linings.
Report Highlights
- Direct asking office rents averaged $38.44 per square foot in December, 1.8 percent higher from the same period last year.
- Office vacancy plateaued over the last six months, averaging 15.5 percent across the top 50 U.S. office markets.
- National office transaction volume totaled $77.5 billion at the end of December 2021.
- The active pipeline included 156.6 million square feet of office space under construction at the end of 2021.
Office transaction volume equaled to $77.5 billion in 2021, surpassing the previous year’s total. Office assets traded at an average $293 per square foot at the end of December 2021. Interestingly, the average sale price of office assets in urban submarkets grew steadily over the previous decade—28 percent over the last two years. Meanwhile, prices in the Commercial Business Districts prices have fallen since the start of the pandemic and reached $323 per square foot in 2021, the lowest mark since 2014. Meanwhile, urban prices increased 28 percent over the last two years.
Tempered increase in asking rates, vacancy
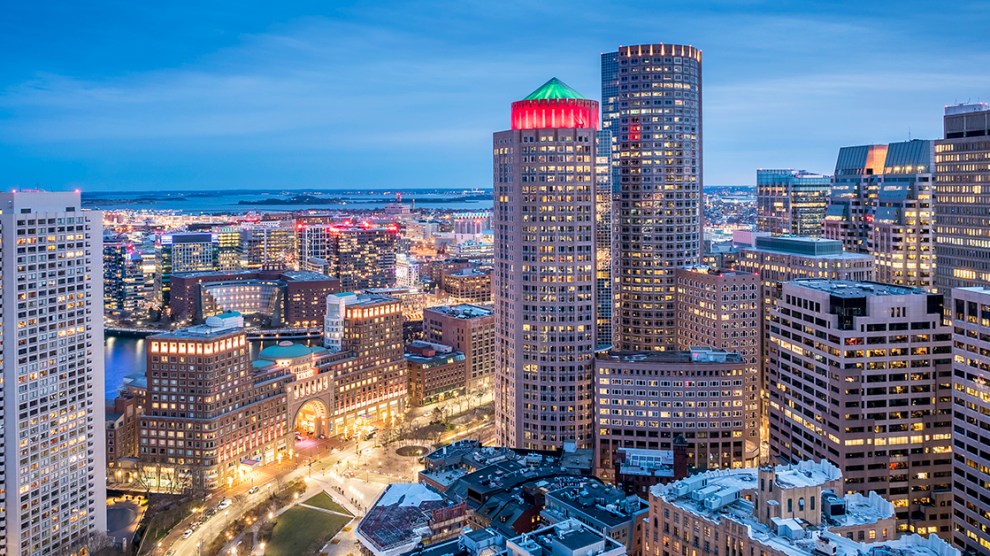
Office vacancy reached 15.5 percent, 130 basis points higher year-over-year in December 2021, but stagnating in the second half of the year. National office asking rates averaged $38.44 per square foot in December, increasing by 180 basis points year-over-year. Significant upticks in asking rates were present in Boston (11.6 percent year-over-year increase), San Diego (11.2 percent increase) and Phoenix (9.5 percent increase).
Planning for the suburban future
Some 156.6 million square feet of office space was under construction across the nation at the end of 2021, with nearly half located in urban submarkets—defined by CommercialEdge as within the city center limits but not located in the CBD. However, the planned portion indicates a shift towards suburban development. At the start of 2020, 35 percent of the planned pipeline was located in suburban areas. The share jumped to 48 percent by the end of 2021.
Developers broke ground on 56.3 million square feet of office space in 2021, with more than half located in just 10 markets. Austin led the way in this sense, with 4.4 million square feet of new office space starts. Dallas and the Bay Area followed closely with 3.8 million square feet of ground breakings.
Read the full Matrix Office National Report-January 2022


Add Comment