


The national office vacancy was 16.5 percent at the end of December 2022, up 90 basis points from the same period in 2021, according to the latest Yardi Matrix report.
Report Highlights
- The average full-service equivalent listing rate was $38.19 per square foot at the end of December 2022, a 70-basis-point decrease year-over-year.
- As of December 2022, office vacancy stood at 16.5 percent across the top 50 U.S. office markets.
- The under-construction pipeline continued to shrink, featuring 135.5 million square feet of office space at the end of December 2022.
- Nationwide office transaction volume totaled $83.6 billion at the end of 2022.
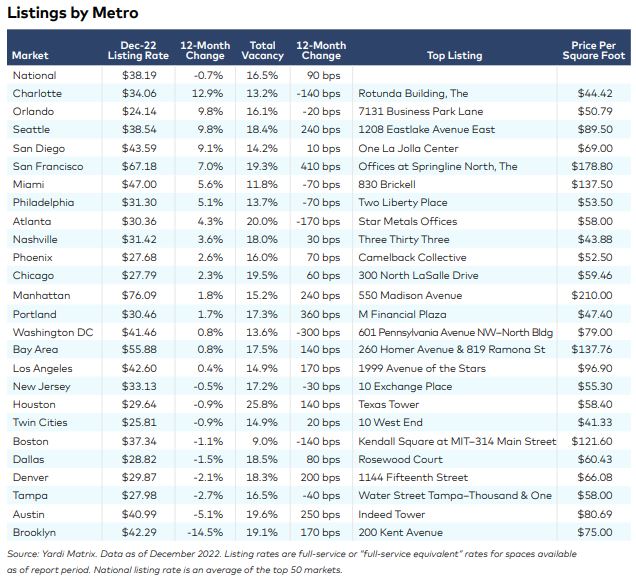
National average full-service equivalent listing rates clocked in at $38.19 per square foot at the end of December 2022, down 70 basis points year-over-year. and by 16 cents when compared to November 2022. The largest gains year-over-year were present in Charlotte (12.9 percent increase), Orlando and Seattle (9.8 percent each) and San Diego (9.1 percent).
Meanwhile, nationwide office vacancy reached 16.5 percent in December 2022, up 90 basis points when compared to the end of 2021. Office vacancy in Washington, D.C., decreased by 300 basis points year-over-year in December 2022; Sun Belt markets including Atlanta (-170 basis points), Charlotte (-140 basis points) and Tampa (-40 basis points) also recorded some of the highest decreases in office vacancy, alongside Boston (-140 basis points).
Slowdown in 2022 Office Investment Market
Office transaction volume totaled $83.6 billion at the end of 2022 and despite a lag in collecting sales data, the amount will not surpass the $116 billion recorded in 2021. Investment activity was concentrated on East Coast markets such as Manhattan ($6 billion), Boston ($4.7 billion), Washington, D.C. ($4.3 billion) and New Jersey ($3.6 billion), as well as Dallas ($4.7 billion) and the Bay Area ($4.6 billion).
Office buildings traded at an average of $247 per square foot at the end of 2022; Average sale prices decreased by 11.8 percent when compared to 2021’s figure of $280. Gateway markets posted the highest average sale prices, with San Francisco ($930 per square foot), Manhattan ($733 per square foot) and Seattle ($542 per square foot) leading the way in this aspect.
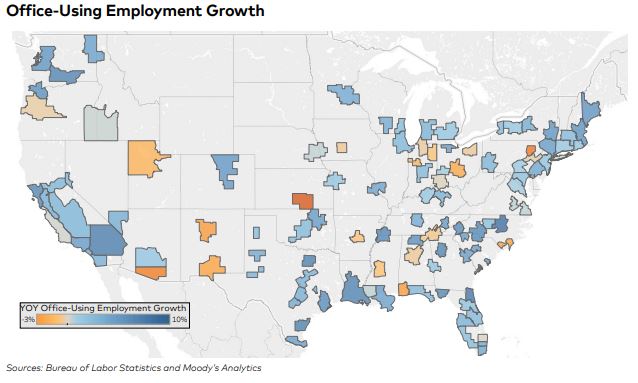
Nationwide, the active pipeline featured some 135.3 million square feet of office space under construction at the end of 2022, representing 2.1 percent of total stock. Another 261.3 million square feet was in planning stages, pushing the rate to 4.0 percent of total stock. Developers concentrated their efforts in tech-centric markets benefitting from office job growth such as Austin (8.7 percent of stock, 7.7 million square feet), Charlotte (6.3 percent, 4.8 million) and Atlanta (6.3 percent, 12.4 million).
Read the full Matrix Office National Report-January 2023


Add Comment