


New leases averaged $9.09 per square foot in the last 12 months, $1.97 more than the average of all leases, the latest Yardi Matrix industrial report shows.
Report Highlights
- National in-place rents for industrial space averaged at $7.12 per square foot at the end of February, a 6.9 percent increase from February 2022.
- Nationwide industrial vacancy averaged 3.9 percent in February, down 10 basis points from the previous month.
- Total industrial transaction volume amounted to $3.9 billion at the end of February.
- The under-construction pipeline featured 667.5 million square feet of industrial space as of February.
Industrial vacancy nationwide stood at 3.9 percent at the end of February, a 10-basis-point decrease from the previous month, the latest Yardi Matrix industrial report shows. Columbus had the lowest vacancy rate in the country (1.1 percent), followed by the Inland Empire (1.7 percent), Phoenix (2.3 percent) and Indianapolis (2.5 percent).
National in-place rents for industrial space averaged $7.12 per square foot in February, increasing by 690 basis points on a year-over-year basis and two cents when compared to January. Port and adjacent markets recorded the highest increases, led by the Inland Empire (15.6 percent year-over-year change), Los Angeles (11.6 percent), Boston (10.7 percent), Orange County (9.2 percent) and Bridgeport (9.0 percent).
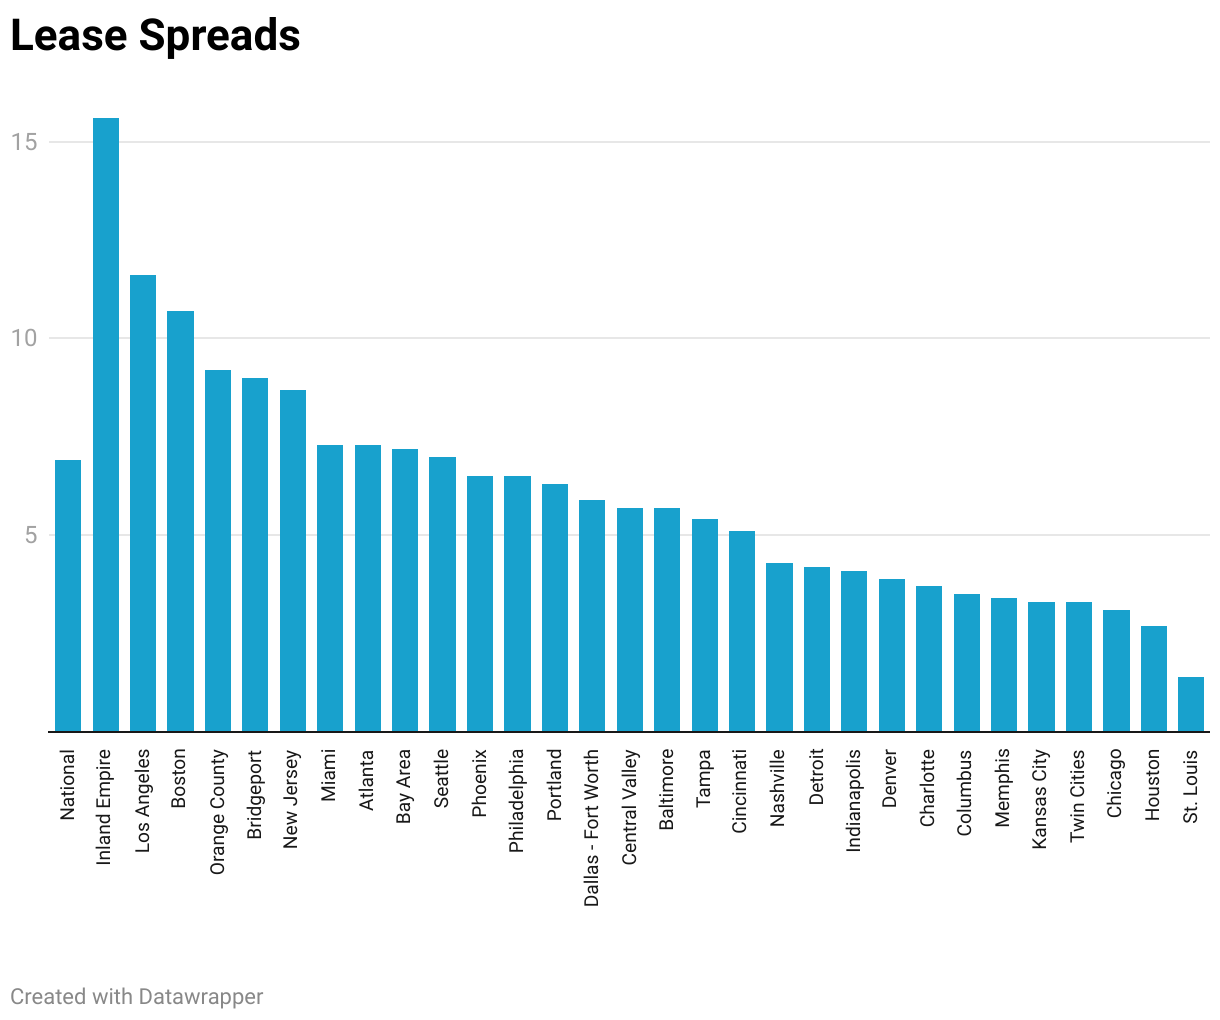
The average cost per square foot for new leases signed within the past year was $9.09 per square foot, which is $1.97 higher than the average cost for all leases. The port markets on both the East and West coasts had the biggest lease spreads, with Los Angeles ($7.16 difference), the Inland Empire ($6.69) and Orange County ($5.39) leading the way in this aspect.
Investment stays hot in Southern California
Industrial sales across the U.S. totaled $3.9 billion at the end of February, and despite a lag in collecting sales data, the amount represents a significant decrease from the $9.1 billion in sales recorded in the first two months of 2022. According to Yardi Matrix, investment activity was concentrated in the Inland Empire ($855 million year-to-date through February), New Jersey ($209 million), Charlotte ($186 million) and Los Angeles ($155 million).
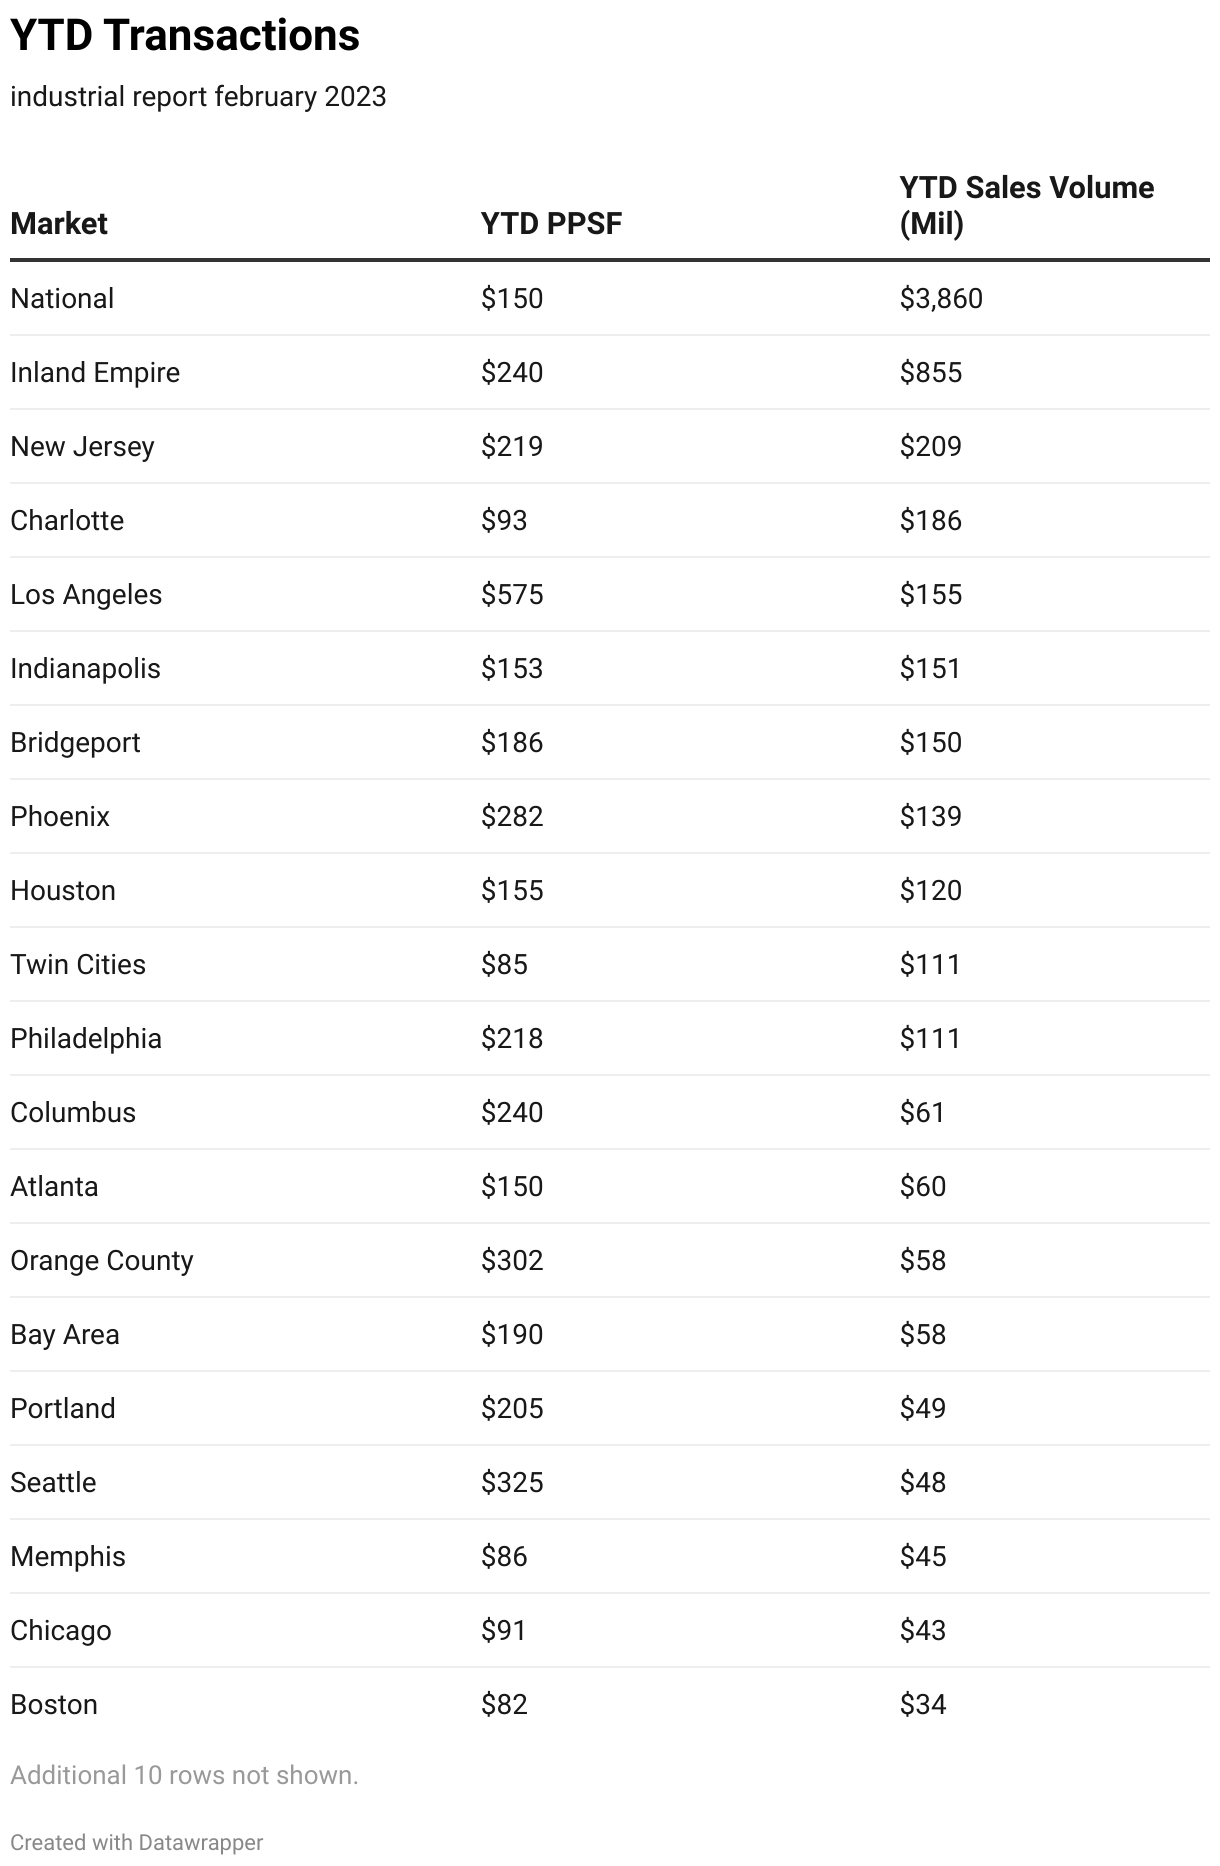
The average sale price of an industrial building was $150 per square foot at the end of February. The markets commanding the highest price per square foot were Los Angeles ($575), Seattle ($325), Phoenix ($282) and Columbus and the Inland Empire ($240).
A total of 667.5 million square feet of industrial space was under construction across the nation at the end of February, accounting for 3.7 percent of total stock. Industrial deliveries in the first two months of 2023 totaled some 73.4 million square feet. Phoenix had the largest pipeline in the country on a percentage-of-stock basis (15.6 percent, 54.0 million square feet), followed by Dallas-Fort Worth (6.7 percent, 58.9 million square feet), Charlotte (5.8 percent, 17.1 million square feet) and Denver (4.6 percent, 11.6 million square feet).
Read the full Matrix Industrial National Report-March 2023


Add Comment