


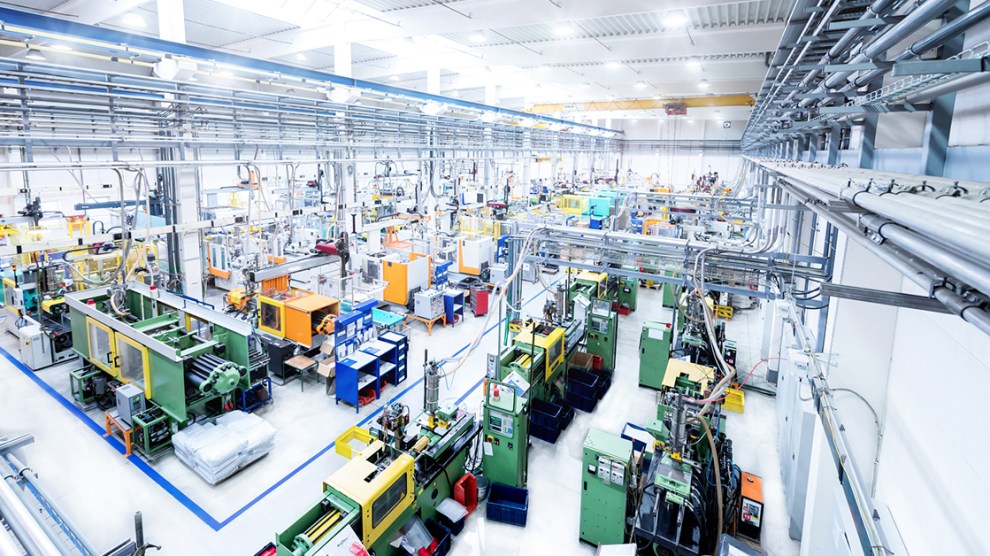
Industrial Sector Stays White-Hot
Report Highlights:
- Rent growth continues its upward trajectory at 3.9 percent year-over-year
- Development activity picks up, with 522.5 million square feet under construction
- With $51.2 billion in sales, transaction volume surpasses last year’s
Yardi Matrix’s November industrial report shows the sector still has room to grow, with skyrocketing demand pushing industrial rents ever upward as development—itself at record highs—struggles to keep up.
Lease rates, premiums continue to rise
Industrial rents averaged $6.37 per square foot in October, a gain of 3.9 percent over the year. Premiums paid for new leases in the past 12 months also shot up, $0.82 per square foot above the national average, showcasing the significant impacts of swelling demand for modern space.
Although rent growth was uneven, most coastal markets exhibited strong increases. The Inland Empire had the swiftest rent gains, up 6.6 percent over the year to $6.45 per square foot in October. Los Angeles and New Jersey also reported notable growth, with increases of 5.7 percent each during the same period. New Jersey’s industrial space also commanded the highest premiums across the country, averaging $2.54 per square foot.
Vacancy increased by 20 basis points over the month to 5.9 percent in September, though this figure masks tightening vacancies in many markets—even those far from the increasing demands placed on the sector by exploding port traffic. While the Inland Empire had the tightest vacancy rate nationwide of 1.0 percent, a 10-basis-point drop over the month, several markets far from ports also reported a significant lack of availability, including Columbus (1.9 percent vacancy) and Nashville (2.8 percent).
Development picks up the pace
At the end of October, industrial projects totaling 522.5 million square feet were underway, or 3.2 percent of total inventory. Deliveries through the end of October this year already exceeded 250 million square feet, though this figure is unlikely to overshadow last year’s record-high of 319.2 million square feet delivered.
The Dallas-Fort Worth market had the highest level of construction activity in October, with 35.3 million square feet underway. However, Phoenix led the nation in terms taking market size into consideration: The city’s nearly 30 million square feet underway accounts for a staggering 11 percent of existing inventory.
Transaction volume exceeds last year
Industrial transactions totaling $51.2 billion closed year-to-date through October, already 8.7 percent higher than last year’s volume of $47.1 billion. Pricing continued to climb: Sales averaged $110 per square foot, 25 percent higher than in 2020.
Los Angeles led the country in total investment activity, with $3.8 billion in deals closed through October. Given the rapid increase in inbound and outbound port activity, pricing jumped to $221 per square foot, exceeded only by Orange County ($294 per square foot) and the Bay Area ($223 per square foot).
Read the full Matrix Industrial Report-November 2021


Add Comment