


Developers completed more than 450 million square feet of industrial space in 2022, according to the latest Yardi Matrix industrial report.
Report Highlights
- National in-place rents for industrial space averaged at $7.03 per square foot in December 2022, a 6.3 percent increase year-over-year.
- Nationwide industrial vacancy averaged 3.9 percent at the end of 2022, down 180 basis points from December 2021.
- Total industrial transaction volume amounted to $88.3 billion at the end of 2022.
- The under-construction pipeline continued to shrink, encompassing 713.0 million square feet of industrial space as of December 2022.
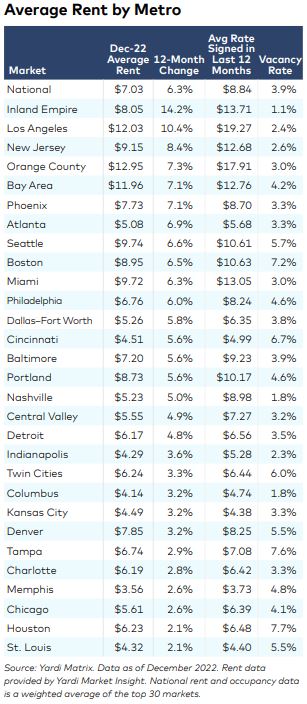
National in-place rents for industrial space averaged $7.03 per square foot in December 2022, up 630 basis points on a year-over-year basis, a three-cent increase when compared to November 2022. Port markets recorded the highest increases, led by the Inland Empire (14.2 percent year-over-year change), Los Angeles (10.4 percent percent) and New Jersey (8.4 percent).
Industrial vacancy nationwide stood at 3.9 percent at the end of December 2022, a 10-basis-point increase from November 2022 but 180 basis points down from December 2021. The Inland Empire had the lowest vacancy rate in the country (1.1 percent), followed by Nashville and Columbus (1.8 percent each), Indianapolis (2.3 percent) and Los Angeles (2.4 percent).
The under-construction pipeline at the end of 2022 featured 713.0 million square feet of industrial space, accounting for 4.0 percent of total stock. Industrial deliveries in 2022 totaled more than 450 million square feet; The markets with the most supply delivered were Dallas (31.5 million square feet), Indianapolis (24.8 million) and Chicago (23.4 million). Meanwhile, Phoenix had the largest pipeline in the country on a percentage-of-stock basis (18.3 percent, 55.0 million square feet), followed by Dallas (7.5 percent, 64.2 million square feet) and Columbus (5.8 percent, 16.5 million square feet).
Sales activity declines, average prices skyrocket
Industrial sales nationwide totaled $88.3 billion at the end of December 2022, and despite a lag in collecting sales data, the amount will likely not surpass 2021’s total of $125.7 billion in transactions. The average sale price of an industrial building was $132 per square foot at the end of the year, increasing by 57 percent since 2019. This, coupled with rising interest rates, contributed to the slowdown in sales activity in the second half of 2022, according to Yardi Matrix.
Investment activity was concentrated in Dallas ($8.8 billion through 2022), Los Angeles ($5.1 billion), the Inland Empire ($5.0 billion), Chicago ($4.2 billion) and Houston ($4.0 billion). Meanwhile, industrial assets traded at the highest price in Southern California markets such as Orange County ($369 per square foot), the Inland Empire ($289 per square foot) and Los Angeles ($287 per square foot), as well as Seattle ($246 per square foot) and Bay Area ($232 per square foot).
Read the full Matrix Industrial Report-January 2023


Add Comment