


Office investment amounted to $20.5 billion year-to-date in August, according to the latest Yardi Matrix report.
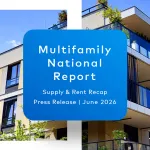
Report Highlights
- The average full-service equivalent listing rate was $37.83 per square foot at the end of August, a 2.2 percent decrease when compared to August 2022.
- Office vacancy continued to rise, reaching 17.5 percent in August across the top 50 U.S. office markets, up 260 basis year-over-year.
- The under-construction pipeline totaled 108.4 million square feet of office space at the end of August.
- Nationwide office transaction volume totaled $20.5 billion year-to-date in August.
Steady rise in office vacancy persists
Nationwide office vacancy stood at 17.5 percent in August, accounting for a 260 basis-point increase when compared to August 2022. The markets with the highest increase in office vacancy on a year-over-year basis were Seattle (590 basis points), San Francisco (510 basis points), Phoenix (480 basis points) and Austin (450 basis points). Meanwhile, Twin Cities, the Bay Area and Denver recorded a 380-basis-point increase each.
National average full-service equivalent listing rates clocked in at $37.83 per square foot at the end of August, decreasing by 220 basis points from August 2022. Average in-place rents were highest in Manhattan ($69.58 per square foot), San Francisco ($65.45) the Bay Area ($55.91), Miami ($46.14) and Boston ($46.13).
Nationwide, the under-construction pipeline waned further, encapsulating 108.4 million square feet of office space under construction at the end of August, or 1.6 percent of total stock. The largest pipeline on a percentage of stock basis was found in Austin (6 million square feet underway, 6.7 percent of stock), Boston (13.9 million, 5.7 percent) and San Diego (5.2 million, 5.5 percent). Nashville (3.0 million) and Seattle (7.2 million) followed with 5.2 percent each.
High-quality property prices plummet in 2023
Office transaction volume totaled $20.5 billion at the end of August, with the average price per square foot standing at $193 per square foot. Investment was concentrated in gateway markets encapsulating a large share of trophy building and amenitized assets such as Manhattan ($1.6 billion), Boston ($1.3 billion) and Los Angeles ($1.2 billion). Meanwhile, office sales in New Jersey totaled $1 billion.
The prices of top-tier properties have experienced a significant drop this year. In 2022, A+ and A-rated buildings sold for $361 per square foot; This year however, prices are down to $233 per foot, marking a 35 percent decrease. This decline is more pronounced than the price drop for A+/A buildings during the 2008-2009 recession. In contrast, Class B properties have only seen a 9 percent decrease in average sale prices this year.
Read the full Matrix Office National Report-September 2023.


Add Comment