

Read the latest Yardi Matrix Office Market Outlook.
Roughly 116 million square feet of office space was underway across the nation as of June, according to the latest Yardi Matrix report.
Report Highlights
- The average full-service equivalent listing rate was $37.82 per square foot at the end of June, a 0.6 percent increase when compared to June 2022.
- Office vacancy continued to go upward, reaching 17.1 percent in June across the top 50 U.S. office markets, up 168 basis year-over-year.
- The under-construction pipeline totaled 115.8 million square feet of office space at the end of June.
- Nationwide office transaction volume totaled $14.8 billion year-to-date in June.
Asking rates soar in key East Coast markets
Nationwide office vacancy stood at 17.1 percent in June, 180 basis points more than in June 2022. Markets encompassing a high concentration of remote workers continued to post the highest office vacancies, with San Francisco (21.1 percent, 360 basis-point increase), Denver (20.4 percent, 310 basis points) and Seattle (20.1 percent, 420 basis points).
National average full-service equivalent listing rates clocked in at $37.82 per square foot at the end of June, increasing by 60 basis points from June 2022. Some of the asking rates were present in San Diego ($46.83 per square foot), Philadelphia ($30.92), New Jersey ($34.51) and Twin Cities ($27.25).
Office investment shifts amid construction contraction
Office transaction volume totaled $14.8 billion at the end of June, with the average price per square foot standing at $199 per square foot at the end of June. Office investment was concentrated in gateway and East Coast markets such as Boston and Manhattan, where office sales amounted to $1.3 billion in each market. Los Angeles followed suit ($1.1 billion), while investment in New Jersey totaled $928 million, mainly due to heightened interest in lab space.
Meanwhile, the medical office sector emerged as a safe investment opportunity for office players; While office sales in the niche recorded a decline on par with the sector’s overall performance, the average prices for medical office buildings remain steady, ranging from $260 to $290 per square foot from 2017 to 2022. In the first half of 2023, the average reached $296 per foot, significantly higher than the national average.
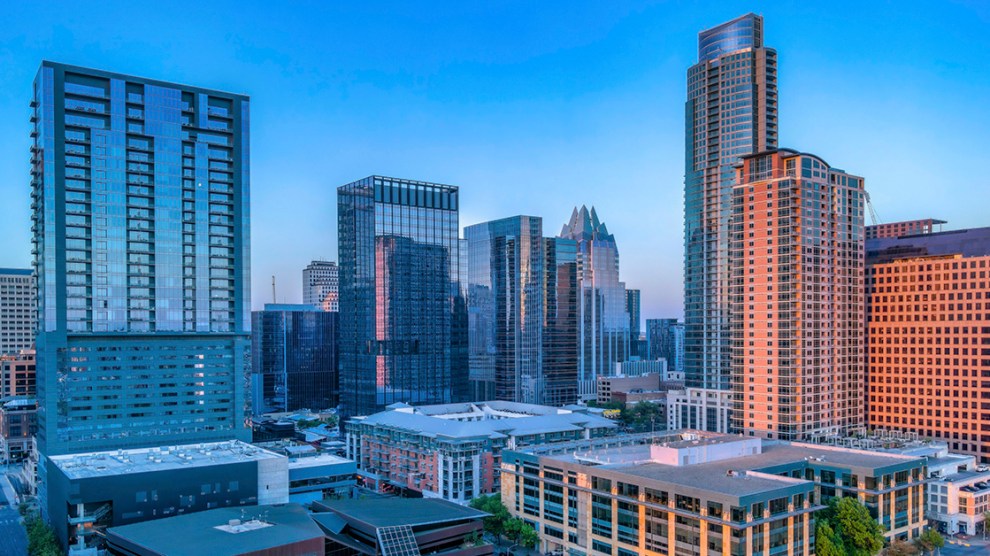
Nationwide, the under-construction pipeline continued to shrink, encapsulating 115.8 million square feet of office space under construction at the end of June, or 1.7 percent of total stock. The largest pipeline on a percentage of stock basis was found in Austin (6.2 million square feet underway, 6.9 percent of stock), Boston (15.1 million, 6.2 percent), Nashville (3.4 million, 5.9 percent), San Diego (5.2 million, 5.6 percent), San Francisco (8.5 million, 5.4 percent) and Seattle (6.8 million, 4.9 percent).
Read the full Matrix Office National Report-July 2023.


Add Comment