


The price per square foot for new leases signed within the last year rose to $9.91, surpassing the overall average by $2.46, according to the latest Yardi Matrix industrial report.
Report Highlights
- National in-place rents for industrial space averaged at $7.45 per square foot at the end of August, a 7.5 percent increase from the same time in 2022.
- The average rate for new leases signed in the last 12 months reached $9.91 per square foot through August.
- Nationwide industrial vacancy remained unchanged from the previous month and averaged 4.4 percent in August.
- Total industrial transaction volume amounted to $33.7 billion at the end of August.
- The under-construction pipeline featured 566.7 million square feet of industrial space as of August.
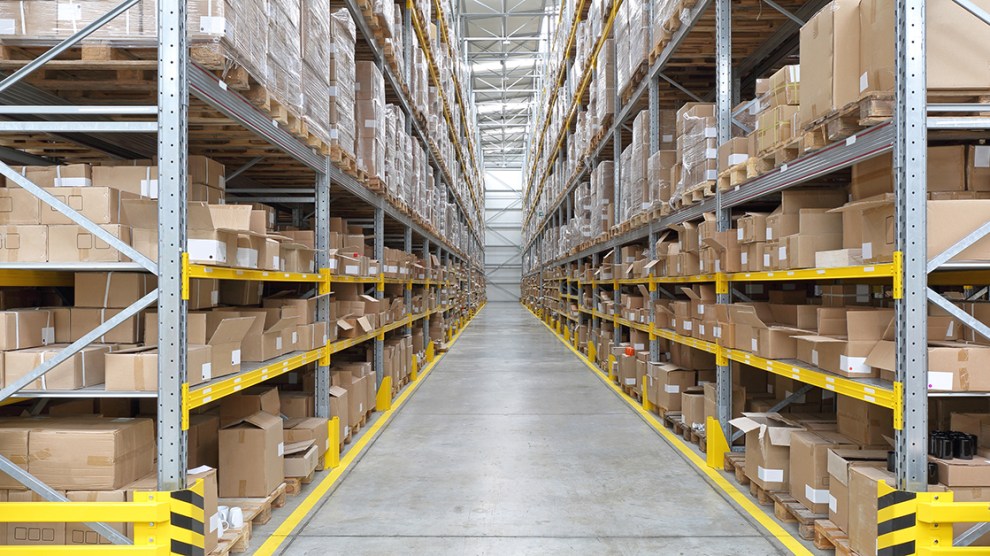
Southern California leads industrial rent surge
National in-place rents for industrial space averaged $7.45 per square foot in August, increasing by 750 basis points on a year-over-year basis and 6 cents when compared to July. Once more, Southern California stands out as the leader in rent increases, particularly in port markets, where the highest rent hikes persist; the Inland Empire saw a 19.2 percent growth in in-place rents over the past year, Los Angeles experienced an 11.8 percent increase and Orange County recorded a 10.5 percent rise.
The average cost per square foot for new leases signed within the past year continued to rise, reaching $9.91 per square foot at the end of August. The amount was $2.46 more than the average for all leases. Rates were highest in Los Angeles ($20.24 per square foot), the Bay Area ($19.48 per square foot), Orange County ($19.41 per square foot), and the Inland Empire ($18.44 per square foot).
Industrial vacancy nationwide remained unchanged from the previous month, clocking in at 4.4 percent at the end of August, the latest Yardi Matrix industrial report shows. The lowest vacancies were present in California markets such as Central Valley (2.9 percent), the Inland Empire (3.3 percent) and Orange County (3.9 percent), as well as in Nashville (2.0 percent), Bridgeport, Conn. (2.6 percent) and Phoenix (3.2 percent).
Uneven distribution of industrial deliveries persists
A total of 566.7 million square feet of industrial space was under construction across the nation at the end of August, accounting for 3.1 percent of total stock. Industrial deliveries year-to-date in August totaled 344.1 million square feet. Although industrial development is booming, a significant portion of the recently delivered space was concentrated in a handful of markets, with the top 15 markets responsible for over 50 percent of this year's completions. Dallas, with 32.1 million square feet, leads as the most active market, surpassing Phoenix, the second-place market, by nearly double with 17.4 million square feet.
At the same time, industrial transaction volume across the U.S. totaled $33.7 billion at the end of August, the latest Yardi Matrix industrial report shows. Industrial properties changed hands at an average of $136 per square foot. Sales activity was concentrated in the Inland Empire ($3.4 billion year-to-date through August), Los Angeles ($2.4 billion), the Bay Area ($2.0 billion), as well as Texas markets such as Houston ($1.7 billion) and Dallas-Fort Worth ($1.6 billion).
Read the full Matrix Industrial National Report-September 2023.


Add Comment