


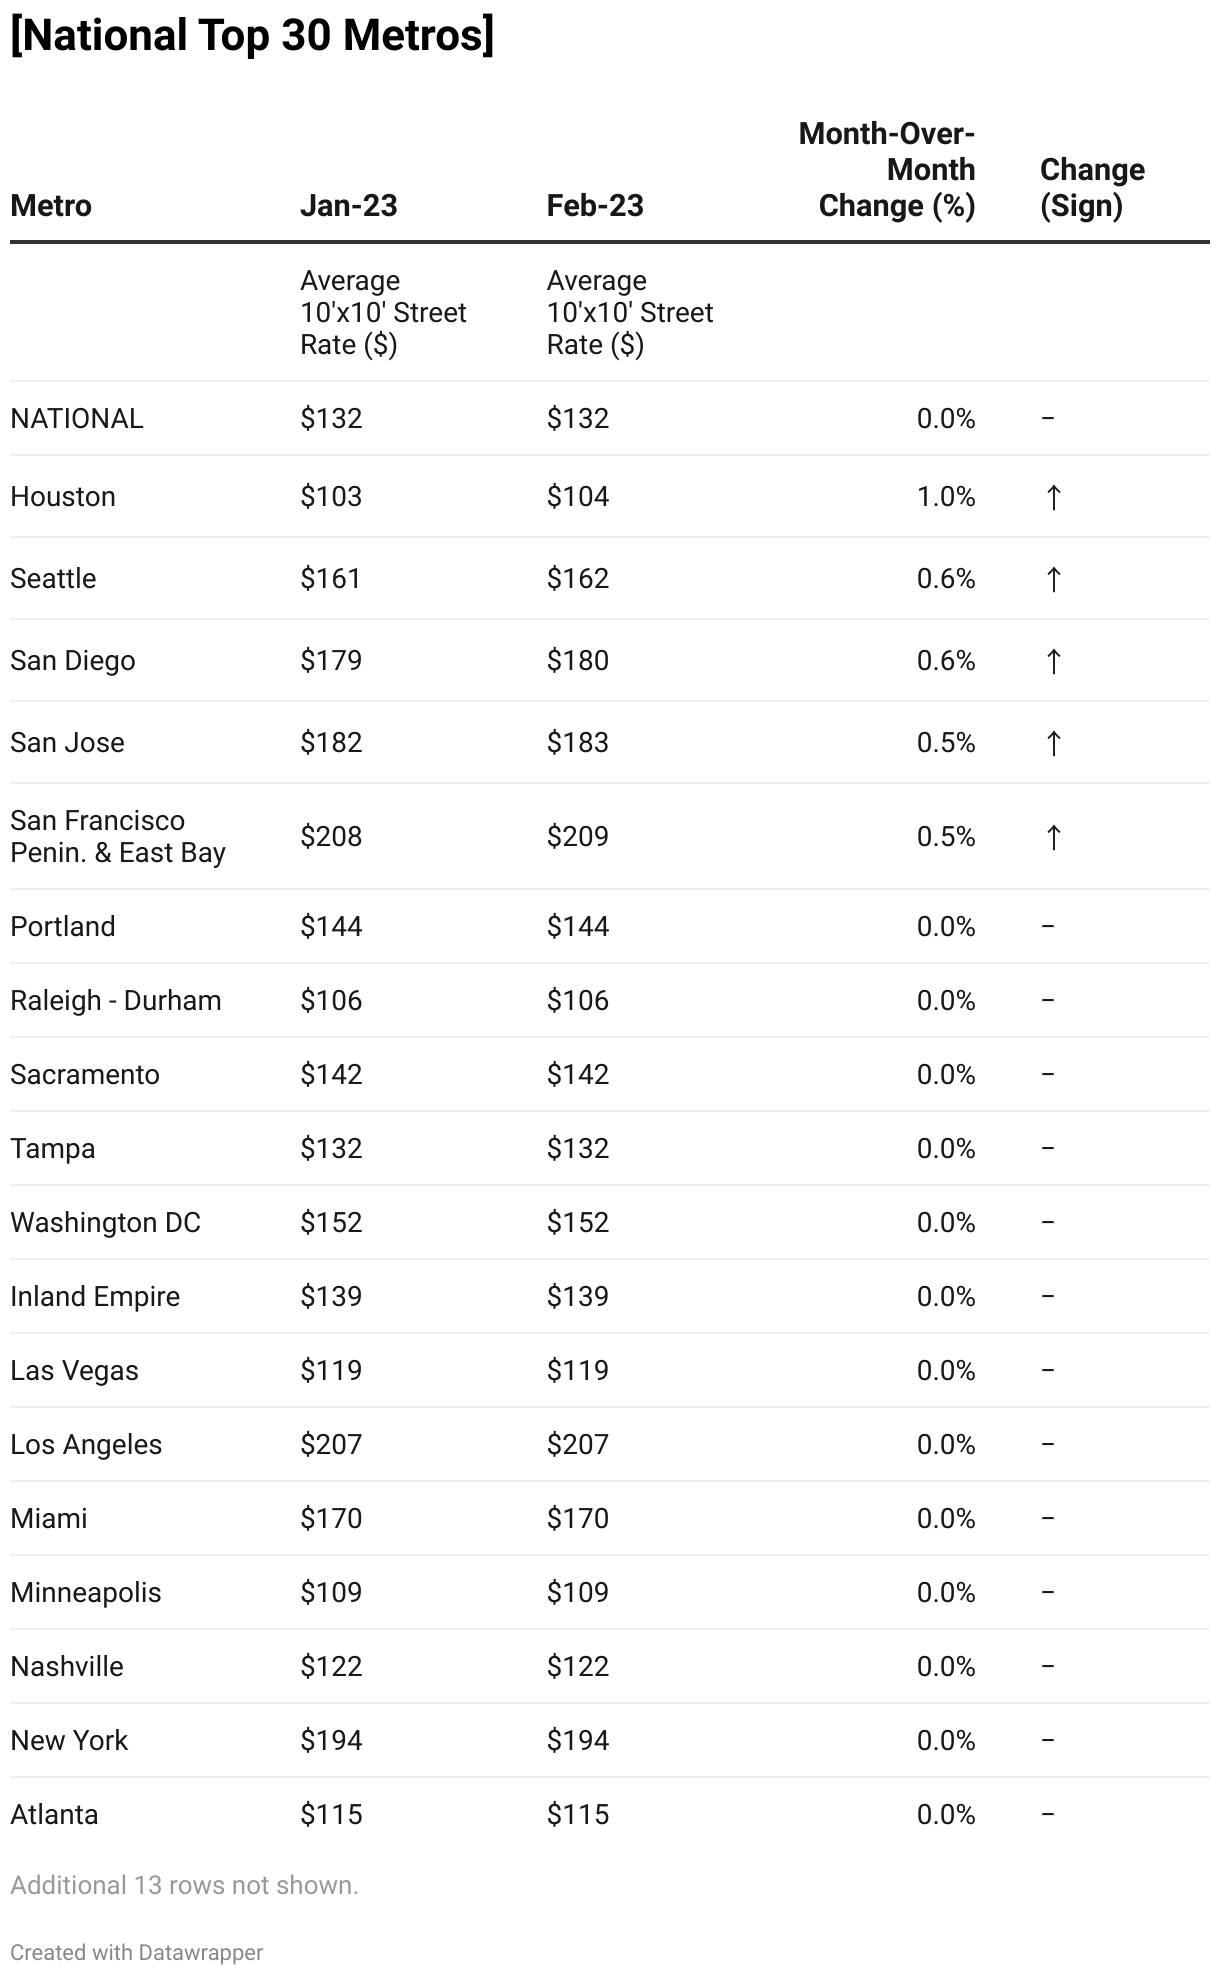
Month-over-month rent growth remained unchanged nationally.
Key Takeaways:
- Annual national street-rate movement remained at -2.8 percent, unchanged from January.
- Overall, only three top markets showed yearly rent increases for the 10×10 non-climate-controlled units and just one for the similar-sized climate-controlled units.
- Month-over-month, national average street rates for the 10×10 combined units were also flat in February with only five markets showing an increase.
- Despite an expected slowdown in new deliveries, none of the top 30 metros tracked by Yardi Matrix saw a monthly decline in construction activity.
As of February, national rates continued to taper, as growth for all unit sizes were at -2.8 percent year-over-year, just as the previous month. Despite the average rate for 10×10 non-climate-controlled units stagnating at $126 since December, it represents a 3.1 percent drop year-over-year. Meanwhile average rates at $141 for the 10×10 climate-controlled options declined 4.1 percent annually.
Overall, only three of the top 30 metros tracked by Yardi Matrix showed increases in rents for the 10×10 non-climate-controlled units. Charlotte and Raleigh-Durham led the list with a 1.0 percent annual increase, while Las Vegas displayed the greatest decline of 9.8 percent. Meanwhile, street rates for 10×10 climate controlled units only increased in Nashville and were down more than 10 percent in Pittsburgh.
On a month-over-month basis, street-rate rents remained level for the 10×10 combined units and the majority of the markets followed this trend. Five markets had rates for the 10×10 non-climate-controlled and climate-controlled units combined increase $1 compared to the January values. Seven markets saw a $1 monthly decrease, among these San Antonio and Charlotte had the largest month-over-month change amounting to a 90-basis-point fall.
Under-construction pipeline leveling
Nationally, there were 4,730 self storage properties in various stages of development as of February. The new-development pipeline included 823 projects under construction, 1,885 self storages in the planning stages as well as 662 prospective facilities. Overall, the national under-construction pipeline amounted to 3.6 percent of the overall inventory, unchanged from January. While only six markets registered an increase in development activity on a monthly basis, no market saw decreases.
Orlando led the top markets as the metro’s under-construction supply relative to existing inventory increased from 6.8 percent in January to 7.2 percent. Washington, D.C., and San Diego experienced similarly large increases month-over-month, a 40-basis-point uptick for all three markets.
Read the full Matrix Self Storage National Report-March 2023


Add Comment