


Key Takeaways:
- As of June, street rate growth for the 10×10 unit types continued to be negative year-over-year.
- National rates for the 10×10 non-climate-controlled and climate-controlled units combined remained at $134, unchanged from the May average.
- Annually, rates for the 10×10 non-climate-controlled units dropped in 30 top metros, while rates for the similar-sized climate-controlled units also fell in all but one metro.
- Construction activity remained steady; the national under-construction pipeline leveled out at 3.6 percent of existing inventory.
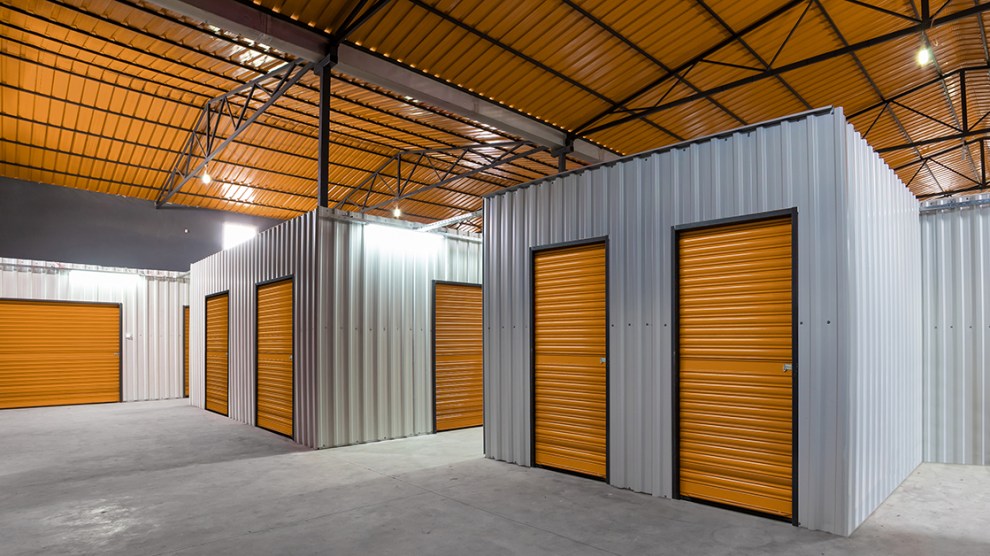
National street rates continue to slide
As of June, national street rates for 10×10 climate-controlled units fell 5.3 percent, the most sizable year-over-year decline since May 2020. Only Charleston was immune to the widespread decrease, as street rates for the 10×10 climate-controlled units remained unchanged. Meanwhile rates for the same-sized non-climate-controlled units registered a 3.8 percent drop on a national level. Rates for 10×10 climate-controlled units also decreased in all top markets except one, as Charlotte rates for this unit type remained level.
On a monthly basis, the combined street rates for the 10×10 non-climate-controlled and climate-controlled units remained unchanged on a national level, staying at $134. This remained true across 15 of the top 31 metros, while the average street rates for 10×10 units increased in 14 metros and decreased in two. Chicago and Washington, D.C. had the largest monthly gains, as rates increased by $2 to $123 and $160, respectively.
New-development pipeline breakdown
As of June, the national pipeline included 4,751 self storage properties in various stages of development. There were 1,913 planned projects, 1,353 abandoned developments, 810 storages under construction, 622 prospective properties, and 53 deferred ones. The under-construction portion of the pipeline made up 3.6 percent of the existing inventory, unchanged from the previous month.
While most of the metros mirrored the national trend and their new-supply pipeline relative to total stock remained unchanged month-over-month, eight of the top 31 markets registered a drop. Even with a 120 basis-point decrease to 7.0 percent, Orlando maintained its top position with more than 1.9 million square feet of projects under construction. Four facilities came online during June in the metro, and there were an additional 3.1 million square feet of projects in the planning stages to feed the pipeline.
Five metros increased their self storage pipeline relative to total stock. Charlotte led the way, with a 40-basis-point growth, expanding the metro’s under-construction pipeline to 4.1 percent of overall stock.
Read the full Matrix Self Storage National Report-July 2023.


Add Comment