


Industrial Pipeline Remains Robust Amid Economic Uncertainty
More than 640 million square feet of industrial space was underway across the nation at the end of April, while another 650 million square feet is in the planning stages, according to the latest Yardi Matrix industrial report.
Report Highlights
- Industrial rents averaged $6.47 per square foot in April, up 4.4 percent from the same period last year.
- Average industrial vacancy clocked in at 5.0 percent, down 120 basis points from January 2021.
- Investment sales amounted to $19.0 billion at the end of April, likely to surpass last year’s record numbers.
- The under-construction industrial pipeline included 640.1 million square feet at the end of April.
Industrial vacancy nationwide was down by 120 basis points compared to January 2021, reaching 5.0 percent in April. While California markets and Midwestern logistic hubs continue to post vacancies well below the national average, coastal markets including New Jersey (2.8 percent) and Miami (3.0 percent) outperformed national rates.
National in-place rents for industrial space averaged $6.47 per square foot in April, increasing by 440 basis points on a year-over-year basis but remaining unchanged from the previous month. California markets continue to post the highest asking rates, closely followed by post markets such as Seattle ($9.03 per square foot), Miami ($9.01 per square foot) and Boston ($8.30 per square foot).
Meanwhile, a new signed lease averaged $7.48 per square foot in the last 12 months—a full dollar higher than the overall rental rate and 13 cents more than it was in March. Although average lease rates signed over the last year were highest in California—led by Orange County ($15.55 per square foot) and Los Angeles ($13.94 per square foot)—St. Louis ranked at the top of the list with a 7.4 percent increase in the average rate over the last 12 months.
Development Driven by Strong Demand
Some 640.1 million square feet of industrial space was under construction across the nation at the end of April, accounting for 3.7 percent of total stock. What’s more, Yardi Matrix forecasts approximately 450 million square feet of space to come online annually over the next five years, with demand likely to outpaces supply in the close future.
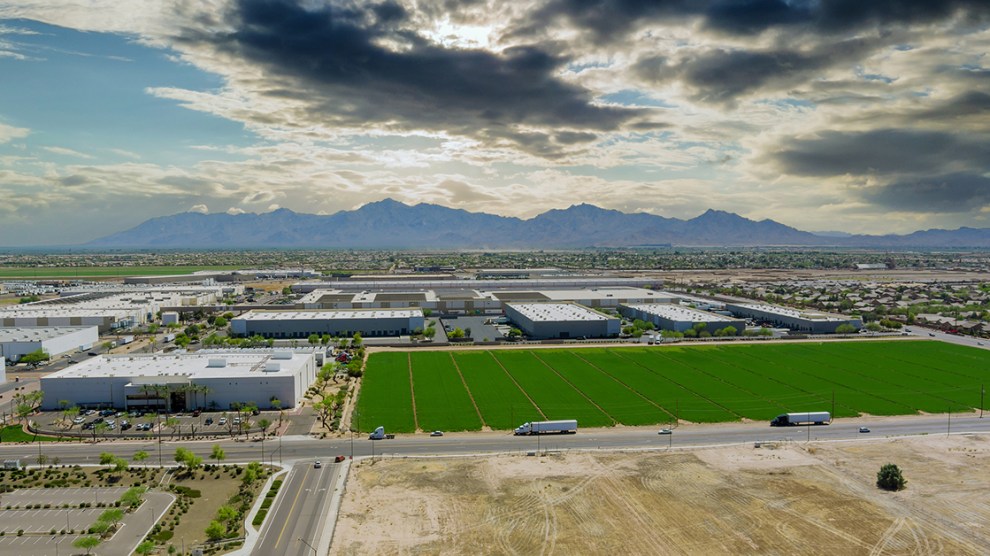
As of April, the markets with the largest pipelines on a percentage of stock basis were Phoenix (41.5 million sq ft under construction, 14.6 percent of stock), Indianapolis (26.2 million, 8.3 percent) and
Dallas (52.7 million, 6.3 percent). Industrial sales in the first four months of the year totaled close to $19 billion, with industrial assets trading at an average $134.10 per square foot.
Read the full Matrix Industrial Report-May 2022


Add Comment