


Report Highlights:
- Rent growth remains elevated at 3.5 percent year-over-year
- Development hits a new high, with 507.5 million square feet under construction
- Transactions are on track to surpass last year’s record as sale prices continue to climb
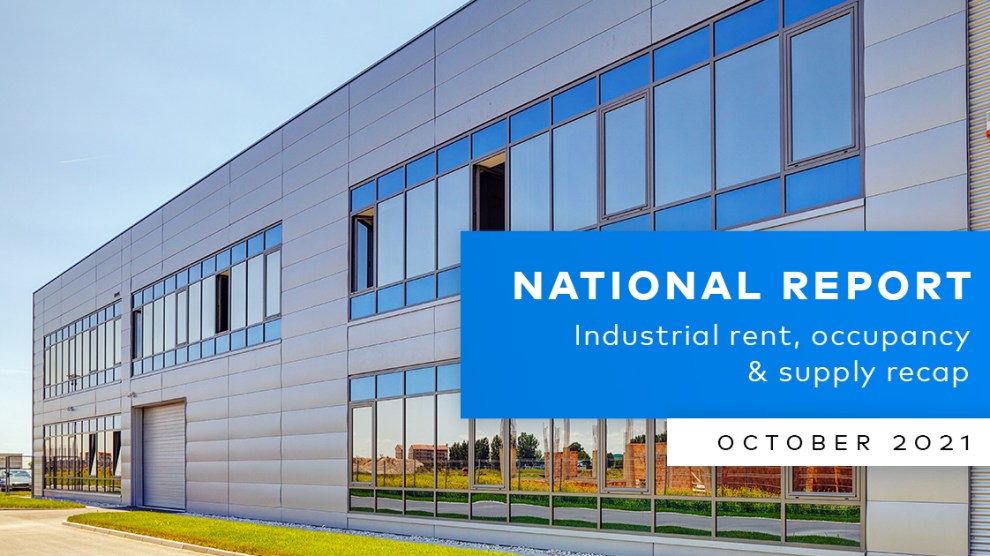
The Yardi Matrix October industrial report highlights how record levels of demand have continued to drive rents higher and development forward. Although industrial operators are facing bottlenecking challenges at all major ports, this has not impacted the sector’s sustained growth.
New leases command hefty premium
Nationwide, rents averaged $6.35 per square foot in September, a 3.5 percent jump year-over-year. Also growing were premiums for new leases signed in the past 12 months, which hit a reported $0.81 per square foot, or 12.8 percent higher than the average national rent.
Rent growth was uneven but positive in all but one of the top 30 industrial markets. New Jersey led, with growth hitting 6.4 percent over the year to an average of $7.85 per square foot. Premiums on the past year’s new leases in the market were the highest across the country at $10.45 per square foot, $2.60 per square foot higher than the market average.
Vacancy fell to 5.7 percent in September, a 20 basis-point drop from a month earlier. The country’s tightest vacancy of 1.1 percent was in the Inland Empire, which other coastal and coastal-adjacent markets not far behind. Several Midwestern markets also registered extremely low vacancies, owing to lower price points and accelerating demand in growing distribution hubs such as Indianapolis (2.3 percent) and Columbus (2.4 percent).
Development hits new heights
At the end of September, 507.5 million square feet of industrial space was under construction across the U.S. Deliveries this year have already exceeded 217 million square feet, with that figure to exceed 300 million square feet by year end, a small decline from the 317 million square feet delivered in 2020.
Dallas-Fort Worth had the most active pipeline in September, with 36.5 million square feet under construction. Developers already had added 50 industrial properties totaling 16.3 million square feet this year, following a banner year for deliveries in 2020, when 28.4 million square feet came online. The market’s relatively low costs, corporate relocations and vast quantities of developable land will continue to play a major role in the growth of the major industrial hub going forward.
Transaction volumes, prices climb
Following a record year in 2020, when $47.1 billion in industrial transactions closed, this year is on track to expand even further, with $41.7 billion in investments in the first three quarters of 2021. Sale prices continue to increase, averaging $108 per square foot this year, far exceeding the 2020 average of $74 per square foot.
Los Angeles had the highest level of investment activity this year through September, with sales totaling $3.3 billion. The Inland Empire wasn’t far behind, with $2.5 billion in deal volume, the second-highest nationwide. The highest sale prices nationwide were next door in Orange County, where industrial assets changed hands for a record $300 per square foot.
Read the full Matrix Industrial Report-October 2021


Add Comment