


The national average full-service equivalent listing rate in February was $38.28 per square foot, down 1.6 percent year-over-year, according to the latest Yardi Matrix report.
Report Highlights
- The average full-service equivalent listing rate was $38.28 per square foot at the end of February, a 1.6 percent decrease from the same time in 2022.
- As of February, office vacancy stood at 16.5 percent across the top 50 U.S. office markets, up 70 basis points from February 2022.
- The under-construction pipeline continued to further contract, featuring 123.5 million square feet of office space at the end of February.
- Nationwide office transaction volume totaled $4.6 billion in the first two months of the year.
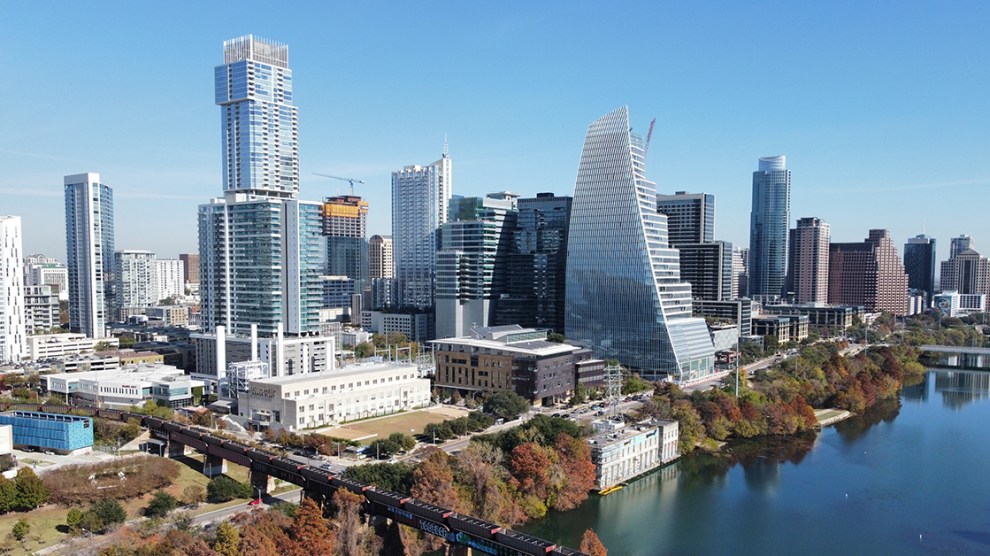
Office vacancy nationwide reached 16.5 percent in February, up 70 basis points when compared to the same time in 2022. The highest rates were recorded in markets with a strong tech footprint, such as Austin (20.4 percent), San Francisco (19.2 percent) or Seattle (18.2 percent).
National average full-service equivalent listing rates clocked in at $38.28 per square foot at the end of February, decreasing by 160 basis points from February 2022, according to Yardi Matrix. The pandemic caused a decline in demand for office space, leading to higher vacancy rates. However, average listing rates have not fallen due to factors such as the quality of space listed and concessions offered by landlords, which are wary of lowering rates and affecting property valuations.
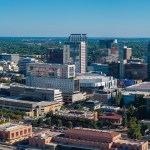
The largest gains year-over-year were present in Orlando (11.6 percent), San Diego (11.3 percent), Seattle (8.8 percent) and Charlotte (8.2 percent). On the other side of the spectrum, Brooklyn (-11.0 percent), Boston (-6.9 percent), Portland (-6.5 percent) and Austin (-5.5 percent) recorded the steepest declines.
Life science properties continue to attract developers, investors
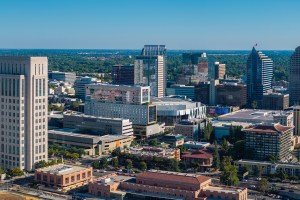
Office transaction volume totaled $4.6 billion at the end of February, and the average price per square foot stood at $232. Sales activity was concentrated on East Coast markets such as Boston ($666 million), New Jersey ($423 million) and Manhattan ($351 million). Despite a decrease in investment due to lower demand for office space and increasing interest rates, investors continue to find lab space appealing. Yardi Matrix expects that sales activity will be strongly driven by life science properties this year.
Nationwide, the active pipeline featured some 123.5 million square feet of office space under construction at the end of February, representing 1.9 percent of total stock. Another 271.3 million square feet was in planning stages, pushing the rate to 6.1 percent of total stock. However, this number may decline in the future as many projects could be put on hold or canceled due to the increasing prevalence of remote and hybrid work in the economy.
The largest pipeline on a percentage of stock basis was found in Austin (6.6 million square feet underway, 7.5 percent of stock), but also in markets with a strong life sciences presence; As of February, Boston had 13.5 million square feet underway, accounting for 5.6 percent of total stock. San Diego had 4.6 million square feet underway, representing 5.0 percent of total stock.
Read the full Matrix Office National Report-March 2023


Add Comment